
Your graphics add a nice touch to my presentations and I recently used them for one of my all-hands meetings. Your toolbox adds professionalism to my slides. Instead of using standard clipart.
Claude Jones, Director of Engineer, @Walmartlabs, USA
Your graphics add a nice touch to my presentations and I recently used them for one of my all-hands meetings. Your toolbox adds professionalism to my slides. Instead of using standard clipart.
Claude Jones, Director of Engineer, @Walmartlabs, USA
I needed a fresh look at some of my slides. I've tried to find a way to create a paintbrush effect, to underline, accentuate, add some color and the handwritten markers were just the things. Very easy to use, easy to size, change the color. It was an affordable, perfect solution and I'm happy to recommend it.
Anonymous, US
The crisp, clean look of the graphics, and the fact that it allowed me to easily edit and change the colors to match the template was my main reason for purchasing them.
Brandie Jenkins, E-learning Developer, USA
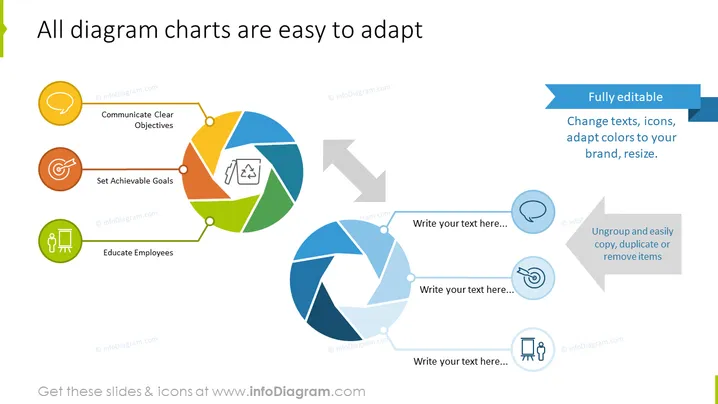
The slide presents the adaptability of diagram charts by showcasing three core aspects: "Communicate Clear Objectives," "Set Achievable Goals," and "Educate Employees." These aspects are visually connected with arrows to two pie charts. "Communicate Clear Objectives" may imply the importance of setting transparent and understandable goals. "Set Achievable Goals" suggests the value of realistic target-setting. "Educate Employees" points towards the need for training and informing staff. On the right, a blue banner with the text "Fully editable" emphasizes the ease of customization of the charts.
The slide uses a clean, professional design with colorful graphics and clear text to convey the message. Icons and pie charts are utilized to visually represent the adaptability and potential customization of diagrams in a presentation or a document.




