

Your graphics add a nice touch to my presentations and I recently used them for one of my all-hands meetings. Your toolbox adds professionalism to my slides. Instead of using standard clipart.
Claude Jones, Director of Engineer, @Walmartlabs, USA

Your graphics add a nice touch to my presentations and I recently used them for one of my all-hands meetings. Your toolbox adds professionalism to my slides. Instead of using standard clipart.
Claude Jones, Director of Engineer, @Walmartlabs, USA
I needed a fresh look at some of my slides. I've tried to find a way to create a paintbrush effect, to underline, accentuate, add some color and the handwritten markers were just the things. Very easy to use, easy to size, change the color. It was an affordable, perfect solution and I'm happy to recommend it.
Anonymous, US
The crisp, clean look of the graphics, and the fact that it allowed me to easily edit and change the colors to match the template was my main reason for purchasing them.
Brandie Jenkins, E-learning Developer, USA
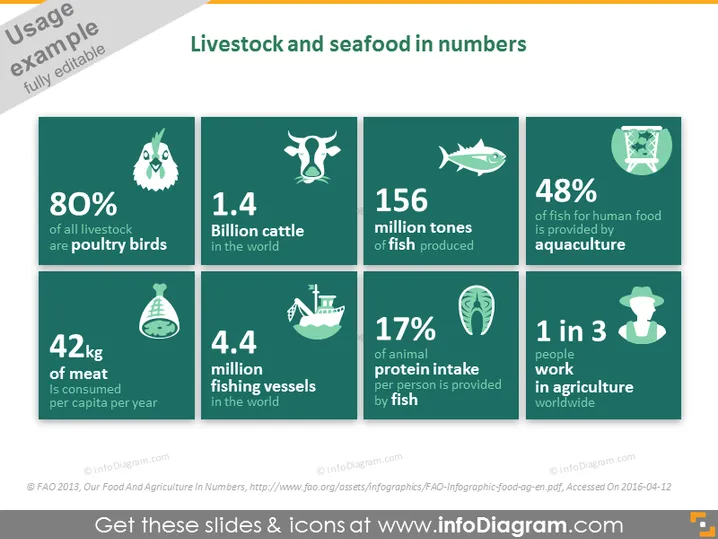
The slide presents statistics about livestock and seafood, highlighting the prevalence of poultry birds in livestock, the number of cattle worldwide, fish production, aquaculture's contribution to fish for human food, meat consumption per person, the number of fishing vessels, the proportion of animal protein intake by fish, and the number of people working in agriculture globally. Each statistic is represented by a figure or percentage, providing a quick numerical snapshot of its respective category—such as 80% of all livestock being poultry birds implying their dominance in the livestock sector, or 1 in 3 people working in agriculture showing the sector's significant employment scale.
The overall look of the slide is modern and professional, with a strong color contrast that aids in comprehension and retention of the presented data. The use of icons adds a visual cue that helps quickly associate the figures with the corresponding statistic.



