

Your graphics add a nice touch to my presentations and I recently used them for one of my all-hands meetings. Your toolbox adds professionalism to my slides. Instead of using standard clipart.
Claude Jones, Director of Engineer, @Walmartlabs, USA

Your graphics add a nice touch to my presentations and I recently used them for one of my all-hands meetings. Your toolbox adds professionalism to my slides. Instead of using standard clipart.
Claude Jones, Director of Engineer, @Walmartlabs, USA
I needed a fresh look at some of my slides. I've tried to find a way to create a paintbrush effect, to underline, accentuate, add some color and the handwritten markers were just the things. Very easy to use, easy to size, change the color. It was an affordable, perfect solution and I'm happy to recommend it.
Anonymous, US
The crisp, clean look of the graphics, and the fact that it allowed me to easily edit and change the colors to match the template was my main reason for purchasing them.
Brandie Jenkins, E-learning Developer, USA
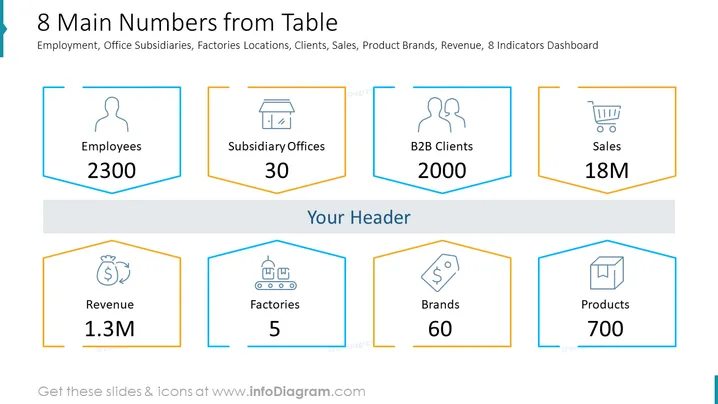
This PowerPoint slide is titled "8 Main Numbers from Table" and deals with business metrics such as Employment, Office Subsidiaries, Factories Locations, Clients, Sales, Product Brands, Revenue, and indicates a Dashboard. It includes numerical values associated with Employees (2300 individuals employed), Subsidiary Offices (30 locations), B2B Clients (2000 clients served), and Sales (18M in currency). Additionally, there is Revenue listed at 1.3M, the number of Factories at 5, Brands at 60, and Products at 700, each suggesting the scale and scope of a company's operations and its market presence.
The overall look of the slide is professional, with a balanced use of color and whitespace that creates an easy-to-follow flow of information. The graphical elements are designed to be visually appealing while effectively communicating key metrics.



