

Your graphics add a nice touch to my presentations and I recently used them for one of my all-hands meetings. Your toolbox adds professionalism to my slides. Instead of using standard clipart.
Claude Jones, Director of Engineer, @Walmartlabs, USA

Your graphics add a nice touch to my presentations and I recently used them for one of my all-hands meetings. Your toolbox adds professionalism to my slides. Instead of using standard clipart.
Claude Jones, Director of Engineer, @Walmartlabs, USA
I needed a fresh look at some of my slides. I've tried to find a way to create a paintbrush effect, to underline, accentuate, add some color and the handwritten markers were just the things. Very easy to use, easy to size, change the color. It was an affordable, perfect solution and I'm happy to recommend it.
Anonymous, US
The crisp, clean look of the graphics, and the fact that it allowed me to easily edit and change the colors to match the template was my main reason for purchasing them.
Brandie Jenkins, E-learning Developer, USA
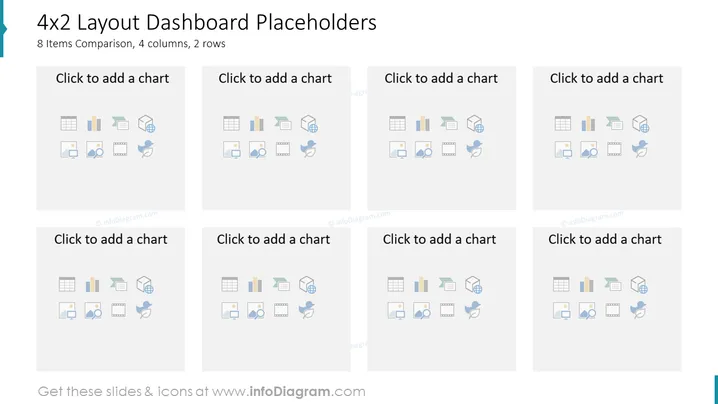
The PowerPoint slide titled '4x2 Layout Dashboard Placeholders' indicates an organized comparison layout that can present up to 8 different items or sets of data across 4 columns and 2 rows. Each cell contains a placeholder text "Click to add a chart" suggesting the ability to customize with different graphical data representations. These placeholders are accompanied by muted icons which illustrate various chart types such as bar graphs, line graphs, pie charts, and symbolic representations for operations like cut, copy, paste, and settings, conveying that these slides are meant for detailed data visualization and comparison.
The overall look of the slide is clean and professional, with sufficient white space to avoid a cluttered appearance. The consistent use of icons and text across all placeholders provides a unified and structured design.



