

Your graphics add a nice touch to my presentations and I recently used them for one of my all-hands meetings. Your toolbox adds professionalism to my slides. Instead of using standard clipart.
Claude Jones, Director of Engineer, @Walmartlabs, USA

Your graphics add a nice touch to my presentations and I recently used them for one of my all-hands meetings. Your toolbox adds professionalism to my slides. Instead of using standard clipart.
Claude Jones, Director of Engineer, @Walmartlabs, USA
I needed a fresh look at some of my slides. I've tried to find a way to create a paintbrush effect, to underline, accentuate, add some color and the handwritten markers were just the things. Very easy to use, easy to size, change the color. It was an affordable, perfect solution and I'm happy to recommend it.
Anonymous, US
The crisp, clean look of the graphics, and the fact that it allowed me to easily edit and change the colors to match the template was my main reason for purchasing them.
Brandie Jenkins, E-learning Developer, USA
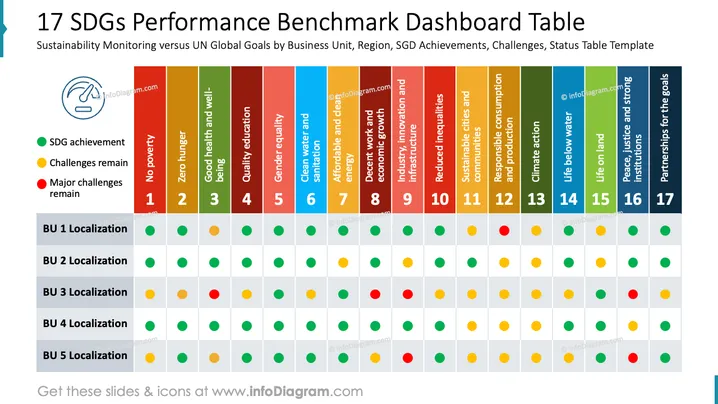
The slide provides a dashboard to monitor the performance of business units against the 17 Sustainable Development Goals (SDGs) adopted by the United Nations. Each goal is represented by a number, covering topics such as poverty, hunger, quality education, gender equality, and climate action. The performance is visualized through colored dots: green for achievement, yellow for remaining challenges, and red for major challenges, across various business units from BU 1 to BU 5.
The overall look of the slide is structured and colorful, allowing for easy comparison between different business units and SDGs. The use of color-coded indicators offers a quick glimpse into the performance status.



