Your graphics add a nice touch to my presentations and I recently used them for one of my all-hands meetings. Your toolbox adds professionalism to my slides. Instead of using standard clipart.
Claude Jones, Director of Engineer, @Walmartlabs, USA
Your graphics add a nice touch to my presentations and I recently used them for one of my all-hands meetings. Your toolbox adds professionalism to my slides. Instead of using standard clipart.
Claude Jones, Director of Engineer, @Walmartlabs, USA
I needed a fresh look at some of my slides. I've tried to find a way to create a paintbrush effect, to underline, accentuate, add some color and the handwritten markers were just the things. Very easy to use, easy to size, change the color. It was an affordable, perfect solution and I'm happy to recommend it.
Anonymous, US
The crisp, clean look of the graphics, and the fact that it allowed me to easily edit and change the colors to match the template was my main reason for purchasing them.
Brandie Jenkins, E-learning Developer, USA
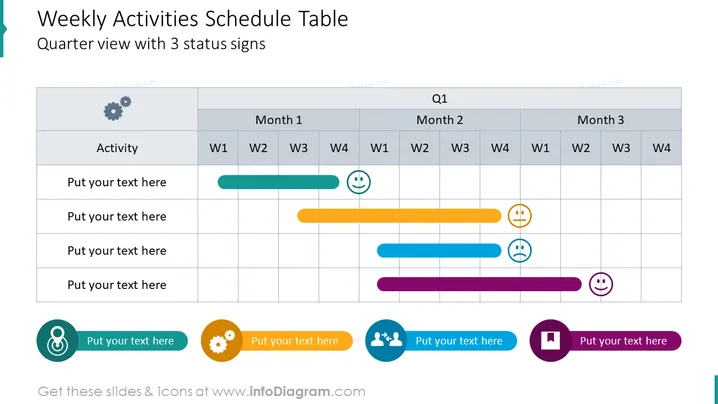
Utilisez ce diapositive de diagramme de Gantt significatif pour indiquer clairement le taux de succès de 4 projets avec des icônes illustratives. Placez des indicateurs de développement de projet contre le tableau du calendrier annuel divisé en trimestres et semaines et ajoutez les noms de projets et des descriptions supplémentaires illustrées par des pictogrammes si nécessaire. En savoir plus sur le diagramme de Gantt sur Wikipedia.
Ce Tableau de Planification des Activités Hebdomadaires avec Modèle de Vue Trimestrielle fait partie de notre Graphiques de Diagramme de Gantt pour le Modèle PPT de Planification de Projet.


