

Your graphics add a nice touch to my presentations and I recently used them for one of my all-hands meetings. Your toolbox adds professionalism to my slides. Instead of using standard clipart.
Claude Jones, Director of Engineer, @Walmartlabs, USA

Your graphics add a nice touch to my presentations and I recently used them for one of my all-hands meetings. Your toolbox adds professionalism to my slides. Instead of using standard clipart.
Claude Jones, Director of Engineer, @Walmartlabs, USA
I needed a fresh look at some of my slides. I've tried to find a way to create a paintbrush effect, to underline, accentuate, add some color and the handwritten markers were just the things. Very easy to use, easy to size, change the color. It was an affordable, perfect solution and I'm happy to recommend it.
Anonymous, US
The crisp, clean look of the graphics, and the fact that it allowed me to easily edit and change the colors to match the template was my main reason for purchasing them.
Brandie Jenkins, E-learning Developer, USA
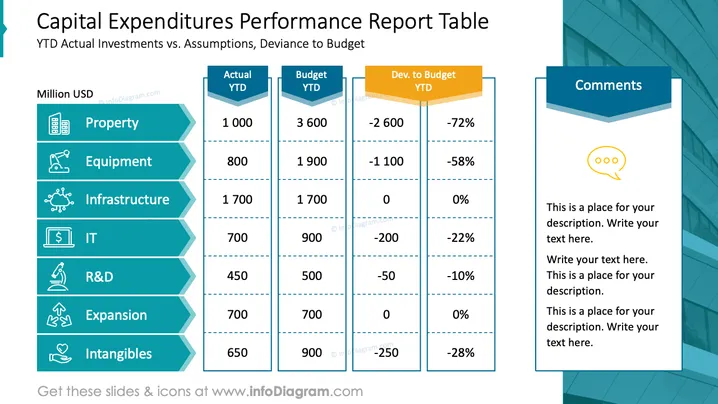
Investissements réels YTD vs. hypothèses, écart par rapport au budget
La diapositive présente un rapport de performance sur les dépenses d'investissement cumulées (Year To Date - YTD), avec des catégories telles que l'immobilier, l'équipement, l'infrastructure, l'informatique, la R&D, l'expansion et les actifs incorporels. Pour chaque catégorie, les investissements réels YTD sont comparés aux budgets, et l'écart par rapport au budget est fourni en chiffres absolus et en pourcentages. L'immobilier affiche l'écart négatif le plus élevé à -72 %, tandis que l'infrastructure et l'expansion n'ont aucun écart. La diapositive comprend également une section de commentaires pour des notes supplémentaires.
La diapositive a une apparence nette et professionnelle avec une démarcation claire des sections. L'utilisation d'icônes ajoute un élément visuel qui aide à identifier rapidement les différentes catégories de dépenses.



