

Your graphics add a nice touch to my presentations and I recently used them for one of my all-hands meetings. Your toolbox adds professionalism to my slides. Instead of using standard clipart.
Claude Jones, Director of Engineer, @Walmartlabs, USA

Your graphics add a nice touch to my presentations and I recently used them for one of my all-hands meetings. Your toolbox adds professionalism to my slides. Instead of using standard clipart.
Claude Jones, Director of Engineer, @Walmartlabs, USA
I needed a fresh look at some of my slides. I've tried to find a way to create a paintbrush effect, to underline, accentuate, add some color and the handwritten markers were just the things. Very easy to use, easy to size, change the color. It was an affordable, perfect solution and I'm happy to recommend it.
Anonymous, US
The crisp, clean look of the graphics, and the fact that it allowed me to easily edit and change the colors to match the template was my main reason for purchasing them.
Brandie Jenkins, E-learning Developer, USA
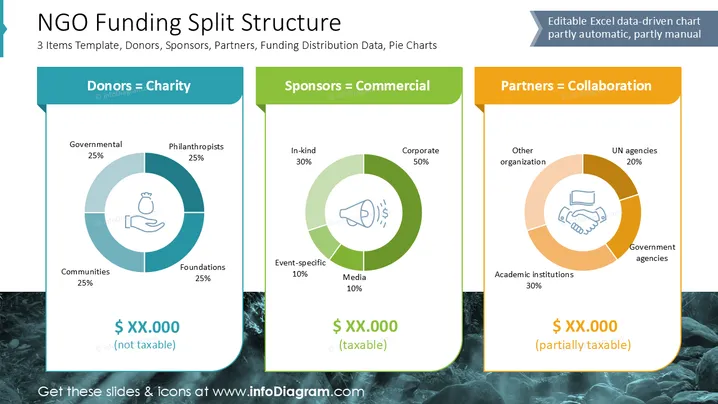
Cette diapositive présente la "Structure de Répartition des Financements des ONG" en mettant en avant les sources de financement : Donateurs comme Bienfaisance, Sponsors comme Commercial, et Partenaires comme Collaboration. Elle utilise des graphiques en secteurs pour montrer la répartition : les Donateurs se composent de Gouvernements (25%), Communautés (25%), Philanthropes (25%), et Fondations (25%). Les Sponsors incluent Corporatif (50%), En nature (30%), Spécifique à l'événement (10%), et Médias (10%). Les Partenaires comprennent les agences gouvernementales (30%), institutions académiques (30%), agences de l'ONU (20%), et autres organisations (20%). Les types de financement sont catégorisés comme non imposables, imposables, ou partiellement imposables.
L'aspect global est professionnel et organisé, utilisant des indices visuels pour distinguer efficacement les différentes sources et partenaires. L'utilisation des couleurs facilite l'absorption rapide des informations.



