

Your graphics add a nice touch to my presentations and I recently used them for one of my all-hands meetings. Your toolbox adds professionalism to my slides. Instead of using standard clipart.
Claude Jones, Director of Engineer, @Walmartlabs, USA

Your graphics add a nice touch to my presentations and I recently used them for one of my all-hands meetings. Your toolbox adds professionalism to my slides. Instead of using standard clipart.
Claude Jones, Director of Engineer, @Walmartlabs, USA
I needed a fresh look at some of my slides. I've tried to find a way to create a paintbrush effect, to underline, accentuate, add some color and the handwritten markers were just the things. Very easy to use, easy to size, change the color. It was an affordable, perfect solution and I'm happy to recommend it.
Anonymous, US
The crisp, clean look of the graphics, and the fact that it allowed me to easily edit and change the colors to match the template was my main reason for purchasing them.
Brandie Jenkins, E-learning Developer, USA
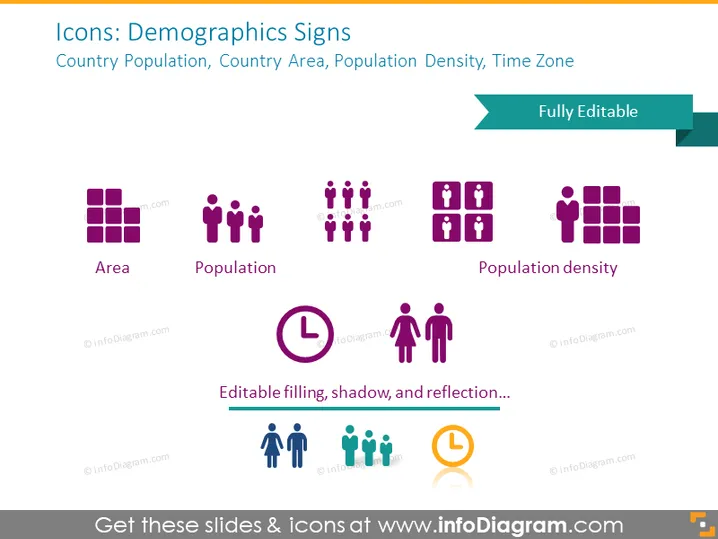
Cette diapositive PowerPoint présente un ensemble d'icônes liées aux démographies : Zone, Population, Densité de Population et Fuseau Horaire. "Zone" a une icône de grille, représentant l'étendue d'un lieu. "La Population" est symbolisée par un groupe de figures humaines, illustrant le nombre d'individus dans un territoire. "Densité de Population" montre ces figures avec des lignes de grille, soulignant le nombre de personnes par unité de surface. Bien que le Fuseau Horaire ne soit pas représenté, une déclaration concernant le fait que la diapositive soit entièrement modifiable est fournie, suggérant une flexibilité dans la personnalisation.
L'apparence générale de la diapositive est moderne et minimaliste, utilisant un schéma de couleurs cohérent et une iconographie claire pour transmettre des concepts démographiques. Le design est professionnel et orienté vers une communication directe.



