Your graphics add a nice touch to my presentations and I recently used them for one of my all-hands meetings. Your toolbox adds professionalism to my slides. Instead of using standard clipart.
Claude Jones, Director of Engineer, @Walmartlabs, USA
Your graphics add a nice touch to my presentations and I recently used them for one of my all-hands meetings. Your toolbox adds professionalism to my slides. Instead of using standard clipart.
Claude Jones, Director of Engineer, @Walmartlabs, USA
I needed a fresh look at some of my slides. I've tried to find a way to create a paintbrush effect, to underline, accentuate, add some color and the handwritten markers were just the things. Very easy to use, easy to size, change the color. It was an affordable, perfect solution and I'm happy to recommend it.
Anonymous, US
The crisp, clean look of the graphics, and the fact that it allowed me to easily edit and change the colors to match the template was my main reason for purchasing them.
Brandie Jenkins, E-learning Developer, USA
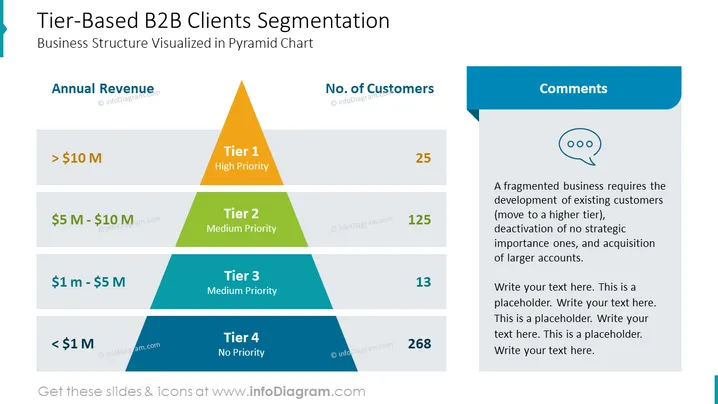
La diapositive présente un modèle de segmentation basé sur les niveaux pour les clients B2B, illustré par un graphique en pyramide qui représente la structure commerciale. Le niveau 1 représente les clients avec un chiffre d'affaires annuel supérieur à 10 millions de dollars et est considéré comme une priorité élevée avec 25 clients. Le niveau 2 désigne les clients de priorité moyenne générant entre 5 millions et 10 millions de dollars de revenus et comprend 125 clients. Le niveau 3, également de priorité moyenne, englobe les entreprises gagnant entre 1 million et 5 millions de dollars avec 13 clients. Le niveau le plus bas, le niveau 4, indique les clients sans priorité avec un revenu inférieur à 1 million de dollars, comptant 268 clients. À côté de la pyramide se trouve une section "Commentaires" suggérant des stratégies telles que le développement des clients existants, la désactivation des comptes non stratégiques et l'acquisition de comptes plus importants.


