Your graphics add a nice touch to my presentations and I recently used them for one of my all-hands meetings. Your toolbox adds professionalism to my slides. Instead of using standard clipart.
Claude Jones, Director of Engineer, @Walmartlabs, USA
Your graphics add a nice touch to my presentations and I recently used them for one of my all-hands meetings. Your toolbox adds professionalism to my slides. Instead of using standard clipart.
Claude Jones, Director of Engineer, @Walmartlabs, USA
I needed a fresh look at some of my slides. I've tried to find a way to create a paintbrush effect, to underline, accentuate, add some color and the handwritten markers were just the things. Very easy to use, easy to size, change the color. It was an affordable, perfect solution and I'm happy to recommend it.
Anonymous, US
The crisp, clean look of the graphics, and the fact that it allowed me to easily edit and change the colors to match the template was my main reason for purchasing them.
Brandie Jenkins, E-learning Developer, USA
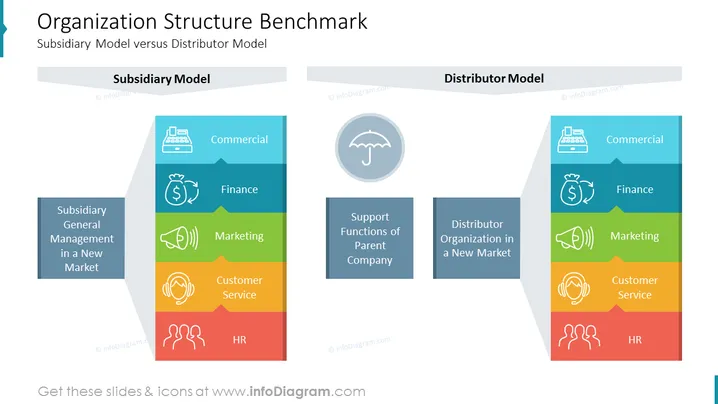
La diapositive compare deux modèles commerciaux : le Modèle de Filiale et le Modèle de Distributeur, expliquant les différentes zones fonctionnelles au sein d'une organisation. Le Modèle de Filiale comprend "Gestion Générale de Filiale dans un Nouveau Marché" et des zones fonctionnelles telles que Commercial, Finance, Marketing, Service Client et RH. Les "Fonctions Supports de la Société Mère" viennent le compléter. Le Modèle de Distributeur comprend "Organisation de Distributeur dans un Nouveau Marché" avec les mêmes zones fonctionnelles. Chaque zone fonctionnelle est associée à une icône qui illustre son rôle, fournissant une représentation visuelle de la structure organisationnelle au sein de deux approches commerciales distinctes.


