

Your graphics add a nice touch to my presentations and I recently used them for one of my all-hands meetings. Your toolbox adds professionalism to my slides. Instead of using standard clipart.
Claude Jones, Director of Engineer, @Walmartlabs, USA

Your graphics add a nice touch to my presentations and I recently used them for one of my all-hands meetings. Your toolbox adds professionalism to my slides. Instead of using standard clipart.
Claude Jones, Director of Engineer, @Walmartlabs, USA
I needed a fresh look at some of my slides. I've tried to find a way to create a paintbrush effect, to underline, accentuate, add some color and the handwritten markers were just the things. Very easy to use, easy to size, change the color. It was an affordable, perfect solution and I'm happy to recommend it.
Anonymous, US
The crisp, clean look of the graphics, and the fact that it allowed me to easily edit and change the colors to match the template was my main reason for purchasing them.
Brandie Jenkins, E-learning Developer, USA
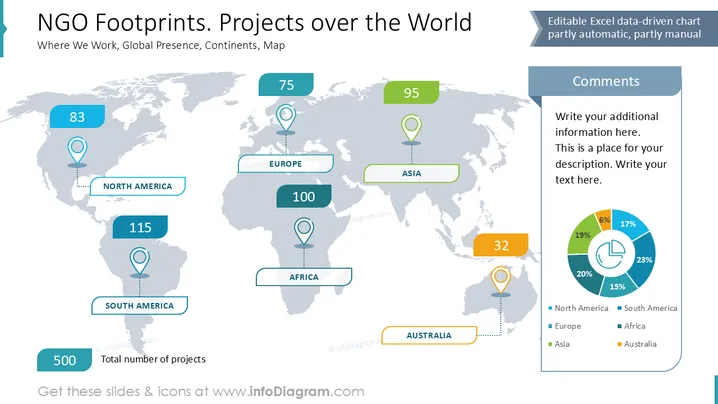
La diapositive fournit un aperçu des projets des ONG répartis dans le monde entier. Elle affiche le nombre de projets dans divers continents : l'Amérique du Nord avec 83 projets reflète une activité modérée. L'Europe, avec 75 projets, montre un niveau d'engagement similaire. L'Asie mène avec 95 projets, mettant en évidence un accent significatif. L'Afrique, avec 100 projets, signifie une forte présence. L'Amérique du Sud contribue grandement avec 115 projets, tandis que l'Australie montre une implication modeste avec 32 projets. Le nombre total de projets est de 500, indiquant un effort mondial considérable.
La diapositive a une mise en page structurée et propre, avec des éléments visuels clairs pour distinguer les données de chaque zone. L'utilisation de couleurs et d'icônes ajoute un aspect complet et facile à lire.



