Your graphics add a nice touch to my presentations and I recently used them for one of my all-hands meetings. Your toolbox adds professionalism to my slides. Instead of using standard clipart.
Claude Jones, Director of Engineer, @Walmartlabs, USA
Your graphics add a nice touch to my presentations and I recently used them for one of my all-hands meetings. Your toolbox adds professionalism to my slides. Instead of using standard clipart.
Claude Jones, Director of Engineer, @Walmartlabs, USA
I needed a fresh look at some of my slides. I've tried to find a way to create a paintbrush effect, to underline, accentuate, add some color and the handwritten markers were just the things. Very easy to use, easy to size, change the color. It was an affordable, perfect solution and I'm happy to recommend it.
Anonymous, US
The crisp, clean look of the graphics, and the fact that it allowed me to easily edit and change the colors to match the template was my main reason for purchasing them.
Brandie Jenkins, E-learning Developer, USA
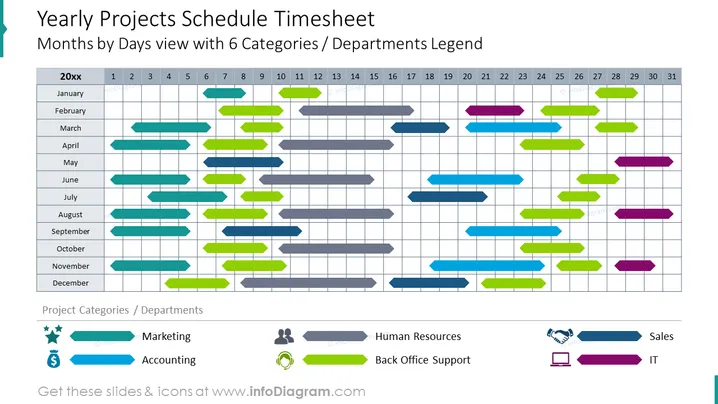
Utilisez ce graphique de Gantt riche pour présenter les projets liés à 6 départements de votre entreprise. Soyez clair dans votre message grâce au code couleur, des icônes significatives illustrant chaque responsable de projet, et des indicateurs de projet modifiables placés par rapport au calendrier annuel divisé en mois et en jours. En savoir plus sur le graphique de Gantt sur Wikipédia.
Ce diagramme de feuille de temps du calendrier des projets annuels fait partie de notre modèle PPT Graphiques de Gantt pour la planification de projet.


