

Your graphics add a nice touch to my presentations and I recently used them for one of my all-hands meetings. Your toolbox adds professionalism to my slides. Instead of using standard clipart.
Claude Jones, Director of Engineer, @Walmartlabs, USA

Your graphics add a nice touch to my presentations and I recently used them for one of my all-hands meetings. Your toolbox adds professionalism to my slides. Instead of using standard clipart.
Claude Jones, Director of Engineer, @Walmartlabs, USA
I needed a fresh look at some of my slides. I've tried to find a way to create a paintbrush effect, to underline, accentuate, add some color and the handwritten markers were just the things. Very easy to use, easy to size, change the color. It was an affordable, perfect solution and I'm happy to recommend it.
Anonymous, US
The crisp, clean look of the graphics, and the fact that it allowed me to easily edit and change the colors to match the template was my main reason for purchasing them.
Brandie Jenkins, E-learning Developer, USA
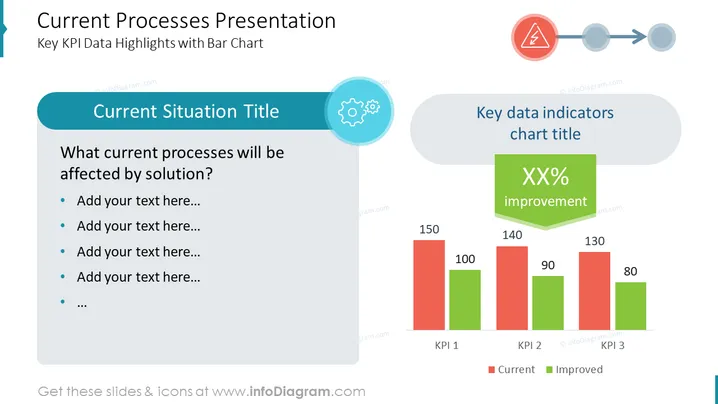
La diapositive intitulée "Présentation des Processus Actuels" met en avant "Principaux Points de Données KPI avec un Graphique à Barres" sur la manière dont certains processus seront affectés par une solution. Le côté gauche de la diapositive contient une section intitulée "Titre de la Situation Actuelle" avec des points à puces où le texte peut être ajouté pour décrire les processus qui seront soumis à changement. À côté de cela, sur le côté droit, se trouve un graphique à barres montrant trois indicateurs clés de performance (KPI), comparant les valeurs "Actuelles" et "Améliorées", soulignant les améliorations de performance.



