Your graphics add a nice touch to my presentations and I recently used them for one of my all-hands meetings. Your toolbox adds professionalism to my slides. Instead of using standard clipart.
Claude Jones, Director of Engineer, @Walmartlabs, USA
Your graphics add a nice touch to my presentations and I recently used them for one of my all-hands meetings. Your toolbox adds professionalism to my slides. Instead of using standard clipart.
Claude Jones, Director of Engineer, @Walmartlabs, USA
I needed a fresh look at some of my slides. I've tried to find a way to create a paintbrush effect, to underline, accentuate, add some color and the handwritten markers were just the things. Very easy to use, easy to size, change the color. It was an affordable, perfect solution and I'm happy to recommend it.
Anonymous, US
The crisp, clean look of the graphics, and the fact that it allowed me to easily edit and change the colors to match the template was my main reason for purchasing them.
Brandie Jenkins, E-learning Developer, USA
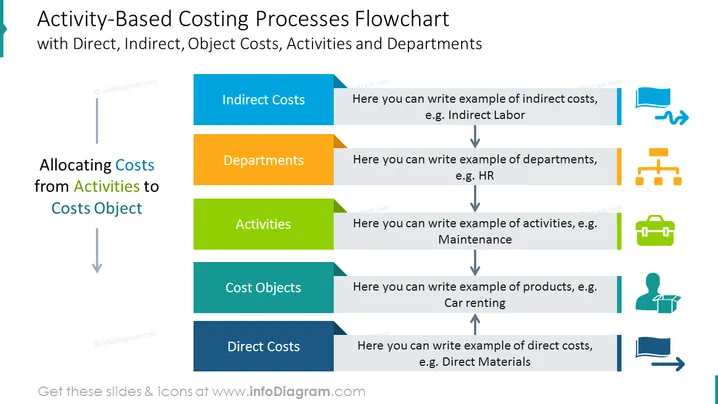
Ce modèle de diapositive PowerPoint est adapté pour illustrer la procédure de coûts basés sur l'activité avec les étapes suivantes : coûts indirects, départements, activités, objets de coût et coûts directs. Utilisez ce diagramme pour expliquer à votre public comment les coûts sont répartis des activités vers les objets de coût. Apprenez-en plus sur le costing basé sur l'activité sur Wikipédia.
- 5 conteneurs de texte modifiables, par exemple, des actions avec des éléments de titre colorés et des icônes
- des flèches symbolisant le flux reliant les éléments du diagramme
- icônes plates du flux monétaire, coûts indirects, structure, diagramme, relations, connexions, départements, valise, activités, une personne avec un produit, objets de coût, coûts directs
Cette diapositive colorée des processus de coûts basés sur l'activité avec icônes fait partie de notre modèle PPT de graphiques comptables basés sur l'activité.


