Your graphics add a nice touch to my presentations and I recently used them for one of my all-hands meetings. Your toolbox adds professionalism to my slides. Instead of using standard clipart.
Claude Jones, Director of Engineer, @Walmartlabs, USA
Your graphics add a nice touch to my presentations and I recently used them for one of my all-hands meetings. Your toolbox adds professionalism to my slides. Instead of using standard clipart.
Claude Jones, Director of Engineer, @Walmartlabs, USA
I needed a fresh look at some of my slides. I've tried to find a way to create a paintbrush effect, to underline, accentuate, add some color and the handwritten markers were just the things. Very easy to use, easy to size, change the color. It was an affordable, perfect solution and I'm happy to recommend it.
Anonymous, US
The crisp, clean look of the graphics, and the fact that it allowed me to easily edit and change the colors to match the template was my main reason for purchasing them.
Brandie Jenkins, E-learning Developer, USA
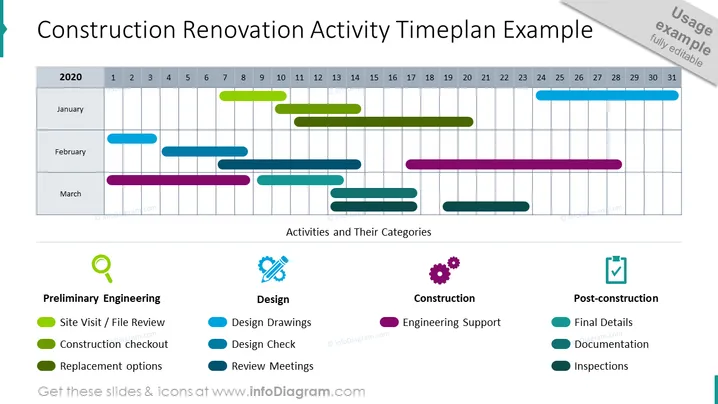
Ce sont des diagrammes de Gantt universels illustrant plusieurs projets appartenant à 4 départements différents tout au long de l'année. Utilisez-le pour discuter des actions entreprises lors de l'ingénierie préliminaire, de la conception, de la construction et de la post-construction. Illustrez leur durée en jours avec des marqueurs de projet colorés modifiables. En savoir plus sur le diagramme de Gantt sur Wikipedia.
Cet exemple de diapositive graphique de plan d'activité de rénovation de construction fait partie de notre modèle de présentation PPT de graphiques de diagramme de Gantt pour la planification de projet.


