

Your graphics add a nice touch to my presentations and I recently used them for one of my all-hands meetings. Your toolbox adds professionalism to my slides. Instead of using standard clipart.
Claude Jones, Director of Engineer, @Walmartlabs, USA

Your graphics add a nice touch to my presentations and I recently used them for one of my all-hands meetings. Your toolbox adds professionalism to my slides. Instead of using standard clipart.
Claude Jones, Director of Engineer, @Walmartlabs, USA
I needed a fresh look at some of my slides. I've tried to find a way to create a paintbrush effect, to underline, accentuate, add some color and the handwritten markers were just the things. Very easy to use, easy to size, change the color. It was an affordable, perfect solution and I'm happy to recommend it.
Anonymous, US
The crisp, clean look of the graphics, and the fact that it allowed me to easily edit and change the colors to match the template was my main reason for purchasing them.
Brandie Jenkins, E-learning Developer, USA
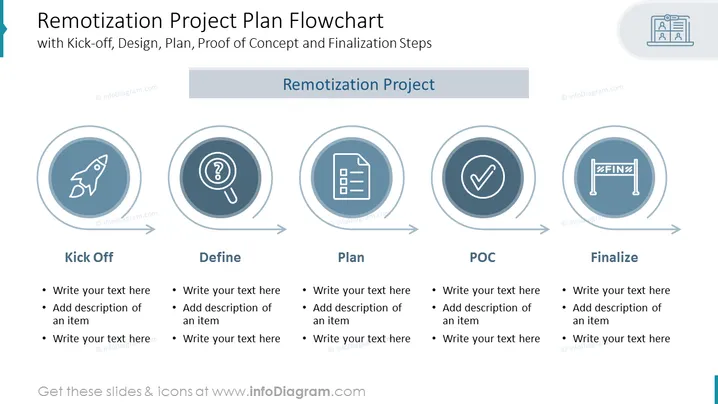
La diapositive intitulée "Plan de projet de remotisation - Diagramme de flux" décrit un processus stratégique pour un projet avec des phases incluant Lancement, Définir, Planifier, Preuve de concept (POC) et Finaliser. Chaque phase est représentée par une icône circulaire et est suivie de espaces réservés pour des détails supplémentaires. 'Lancement' symbolise l'initiation du projet, 'Définir' concerne la définition des objectifs et des portées du projet, 'Planifier' implique l'élaboration des étapes et des ressources nécessaires, 'POC' fait référence à l'évaluation de la faisabilité du projet, et 'Finaliser' représente l'achèvement et la clôture formelle du projet.
La diapositive présente un design propre et moderne, avec un flux logique facile à suivre. Elle utilise des métaphores visuelles pour chaque phase du projet afin de communiquer rapidement la progression du projet d'un coup d'œil.



