

Your graphics add a nice touch to my presentations and I recently used them for one of my all-hands meetings. Your toolbox adds professionalism to my slides. Instead of using standard clipart.
Claude Jones, Director of Engineer, @Walmartlabs, USA

Your graphics add a nice touch to my presentations and I recently used them for one of my all-hands meetings. Your toolbox adds professionalism to my slides. Instead of using standard clipart.
Claude Jones, Director of Engineer, @Walmartlabs, USA
I needed a fresh look at some of my slides. I've tried to find a way to create a paintbrush effect, to underline, accentuate, add some color and the handwritten markers were just the things. Very easy to use, easy to size, change the color. It was an affordable, perfect solution and I'm happy to recommend it.
Anonymous, US
The crisp, clean look of the graphics, and the fact that it allowed me to easily edit and change the colors to match the template was my main reason for purchasing them.
Brandie Jenkins, E-learning Developer, USA
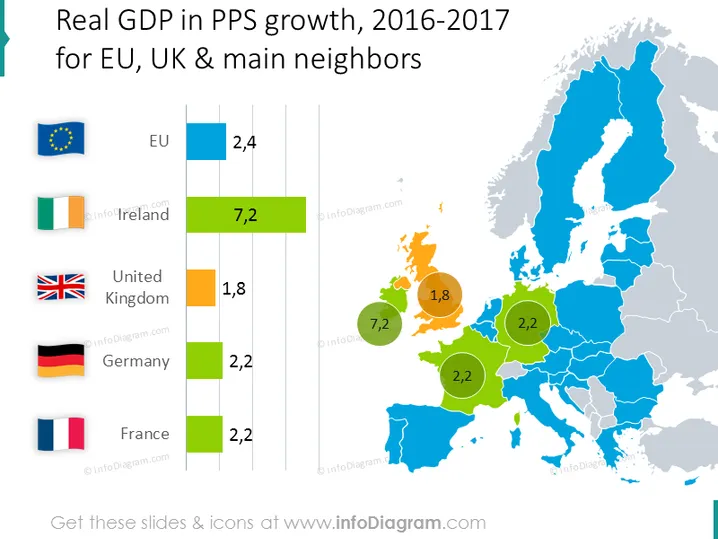
Contenu La diapositive fournit une comparaison de la croissance du PIB réel en Normes de Pouvoir d'Achat (PPA) pour l'Union Européenne, le Royaume-Uni, l'Irlande, l'Allemagne et la France entre 2016 et 2017. L'UE affiche une croissance de 2,4 %, tandis que l'Irlande est en tête avec une croissance significative de 7,2 %. Le Royaume-Uni suit de près avec un taux de 1,8 %, et l'Allemagne ainsi que la France sont à 2,2 %. Chaque pourcentage illustre probablement le taux de croissance économique de ces régions durant la période spécifiée. ### Aspect Graphique - Un graphique à barres horizontal sur la gauche affiche les chiffres de croissance avec les drapeaux des pays correspondants. - L'UE est représentée avec le drapeau de l'UE et une barre bleue montrant une croissance de 2,4 %.



