Your graphics add a nice touch to my presentations and I recently used them for one of my all-hands meetings. Your toolbox adds professionalism to my slides. Instead of using standard clipart.
Claude Jones, Director of Engineer, @Walmartlabs, USA
Your graphics add a nice touch to my presentations and I recently used them for one of my all-hands meetings. Your toolbox adds professionalism to my slides. Instead of using standard clipart.
Claude Jones, Director of Engineer, @Walmartlabs, USA
I needed a fresh look at some of my slides. I've tried to find a way to create a paintbrush effect, to underline, accentuate, add some color and the handwritten markers were just the things. Very easy to use, easy to size, change the color. It was an affordable, perfect solution and I'm happy to recommend it.
Anonymous, US
The crisp, clean look of the graphics, and the fact that it allowed me to easily edit and change the colors to match the template was my main reason for purchasing them.
Brandie Jenkins, E-learning Developer, USA
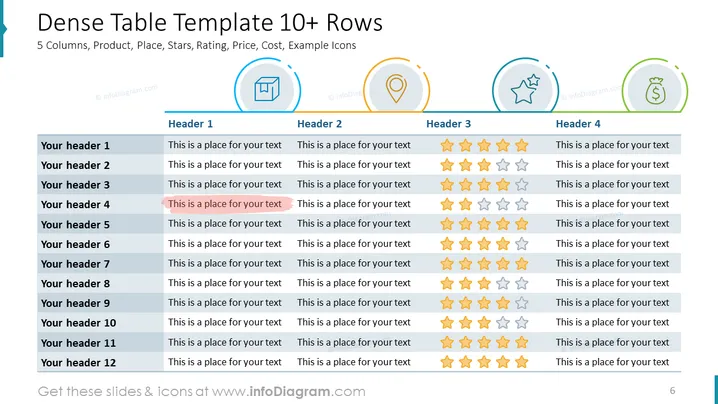
Cette diapositive présente un tableau détaillé intitulé "Modèle de tableau dense 10+ lignes", qui semble conçu pour évaluer plusieurs produits ou articles selon divers paramètres. Le tableau est catégorisé en cinq en-têtes principaux représentant différents attributs : Produit, Lieu, Étoiles (Évaluation) et Prix ou Coût. Sous chaque en-tête, il y a des espaces pour ajouter du texte pour 12 articles ou produits différents. La colonne "Étoiles" est remplie d'icônes d'étoiles pour représenter visuellement les évaluations, et les autres colonnes contiennent du texte espace réservé indiquant où des informations détaillées devraient être insérées.
Le design de la diapositive est moderne et organisé, avec un schéma de couleurs qui aide à distinguer les différentes sections du tableau. Les icônes sont simples mais informatives, offrant une représentation claire du thème de chaque catégorie sans submerger le spectateur.


