
Your graphics add a nice touch to my presentations and I recently used them for one of my all-hands meetings. Your toolbox adds professionalism to my slides. Instead of using standard clipart.
Claude Jones, Director of Engineer, @Walmartlabs, USA
Your graphics add a nice touch to my presentations and I recently used them for one of my all-hands meetings. Your toolbox adds professionalism to my slides. Instead of using standard clipart.
Claude Jones, Director of Engineer, @Walmartlabs, USA
I needed a fresh look at some of my slides. I've tried to find a way to create a paintbrush effect, to underline, accentuate, add some color and the handwritten markers were just the things. Very easy to use, easy to size, change the color. It was an affordable, perfect solution and I'm happy to recommend it.
Anonymous, US
The crisp, clean look of the graphics, and the fact that it allowed me to easily edit and change the colors to match the template was my main reason for purchasing them.
Brandie Jenkins, E-learning Developer, USA
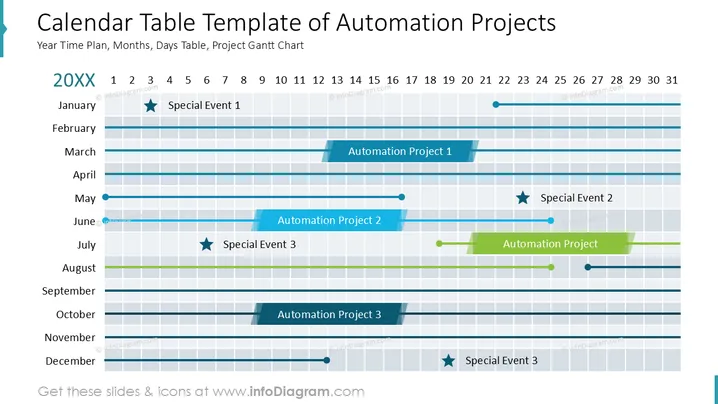
Cette diapositive illustre une chronologie des projets d'automatisation au cours des mois d'une année, avec des événements clés marqués. "Événement Spécial 1" représente une occurrence notable se produisant en janvier. "Projet d'Automatisation 1" s'étend d'avril à juin, illustrant une tâche en cours. "Projet d'Automatisation 2" suit, s'étendant de juin à août. Un "Événement Spécial 2" est prévu pour juillet. Une autre tâche, "Projet d'Automatisation", s'étend également au mois d'août. La diapositive note également "Projet d'Automatisation 3" pour octobre, et un "Événement Spécial 3" qui a lieu en juillet et décembre.
La diapositive est visuellement structurée pour une lecture facile, avec une claire différenciation des couleurs entre les éléments et une disposition en grille qui aligne avec précision les chronologies.




