
Your graphics add a nice touch to my presentations and I recently used them for one of my all-hands meetings. Your toolbox adds professionalism to my slides. Instead of using standard clipart.
Claude Jones, Director of Engineer, @Walmartlabs, USA
Your graphics add a nice touch to my presentations and I recently used them for one of my all-hands meetings. Your toolbox adds professionalism to my slides. Instead of using standard clipart.
Claude Jones, Director of Engineer, @Walmartlabs, USA
I needed a fresh look at some of my slides. I've tried to find a way to create a paintbrush effect, to underline, accentuate, add some color and the handwritten markers were just the things. Very easy to use, easy to size, change the color. It was an affordable, perfect solution and I'm happy to recommend it.
Anonymous, US
The crisp, clean look of the graphics, and the fact that it allowed me to easily edit and change the colors to match the template was my main reason for purchasing them.
Brandie Jenkins, E-learning Developer, USA
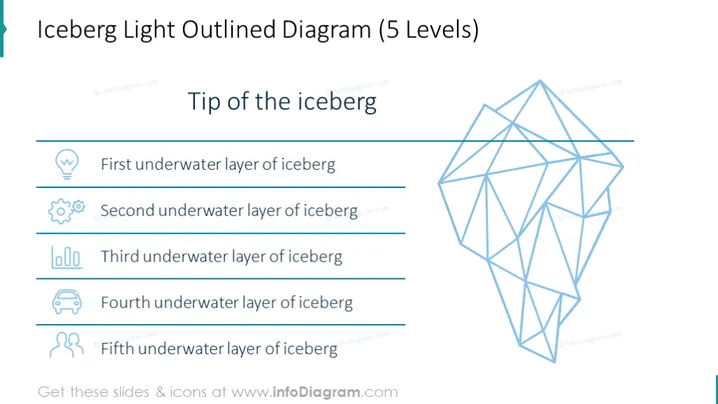
La diapositive affiche un "Diagramme de l'Iceberg Légèrement Contouré" qui segmente les éléments d'un concept ou problème en cinq niveaux. Le "Sommet de l'iceberg" symbolise les aspects les plus visibles. La "Première couche sous-marine de l'iceberg" fait allusion aux facteurs initialement cachés. En descendant, la "Deuxième couche sous-marine" et "Troisième couche sous-marine" signifient des problèmes de plus en plus complexes et profonds. La "Quatrième couche sous-marine" révèle des aperçus plus profonds, et la "Cinquième couche sous-marine" représente les éléments les plus profonds et fondamentaux qui sont généralement hors de vue.
Le design de la diapositive est propre et direct, mettant l'accent sur la segmentation de l'iceberg en cinq couches distinctes grâce à l'utilisation d'icônes claires et d'un schéma de couleurs monochromes.




