

Your graphics add a nice touch to my presentations and I recently used them for one of my all-hands meetings. Your toolbox adds professionalism to my slides. Instead of using standard clipart.
Claude Jones, Director of Engineer, @Walmartlabs, USA

Your graphics add a nice touch to my presentations and I recently used them for one of my all-hands meetings. Your toolbox adds professionalism to my slides. Instead of using standard clipart.
Claude Jones, Director of Engineer, @Walmartlabs, USA
I needed a fresh look at some of my slides. I've tried to find a way to create a paintbrush effect, to underline, accentuate, add some color and the handwritten markers were just the things. Very easy to use, easy to size, change the color. It was an affordable, perfect solution and I'm happy to recommend it.
Anonymous, US
The crisp, clean look of the graphics, and the fact that it allowed me to easily edit and change the colors to match the template was my main reason for purchasing them.
Brandie Jenkins, E-learning Developer, USA
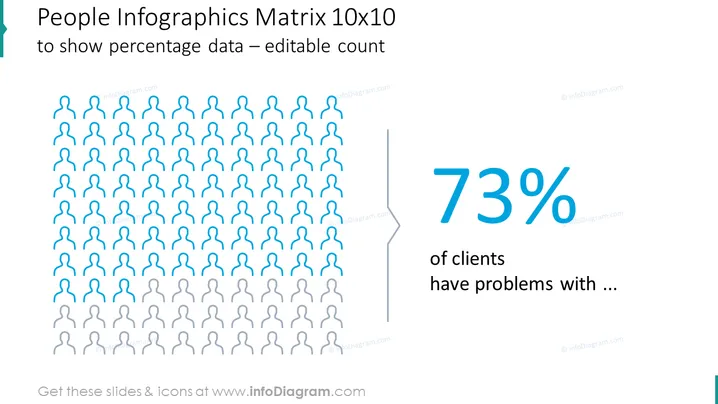
La diapositive présente une "Matrice Infographique sur les Personnes 10x10" comme un outil visuel pour afficher des données en pourcentage, en particulier un compte modifiable. Elle comprend une grille d'icônes représentant des individus, avec une portion mise en évidence pour indiquer un pourcentage. Accompagnant cela, un grand symbole "73%" et un texte indiquant que ce chiffre se rapporte à "les clients rencontrent des problèmes avec ...," suggérant une enquête ou un résultat statistique où la majorité d'un groupe a rencontré des problèmes.
La diapositive a une présentation visuelle professionnelle et claire, conçue pour communiquer efficacement des données statistiques. L'utilisation du contraste des couleurs et de la différenciation des tailles aide à mettre en évidence les informations clés.



