
Your graphics add a nice touch to my presentations and I recently used them for one of my all-hands meetings. Your toolbox adds professionalism to my slides. Instead of using standard clipart.
Claude Jones, Director of Engineer, @Walmartlabs, USA
Your graphics add a nice touch to my presentations and I recently used them for one of my all-hands meetings. Your toolbox adds professionalism to my slides. Instead of using standard clipart.
Claude Jones, Director of Engineer, @Walmartlabs, USA
I needed a fresh look at some of my slides. I've tried to find a way to create a paintbrush effect, to underline, accentuate, add some color and the handwritten markers were just the things. Very easy to use, easy to size, change the color. It was an affordable, perfect solution and I'm happy to recommend it.
Anonymous, US
The crisp, clean look of the graphics, and the fact that it allowed me to easily edit and change the colors to match the template was my main reason for purchasing them.
Brandie Jenkins, E-learning Developer, USA
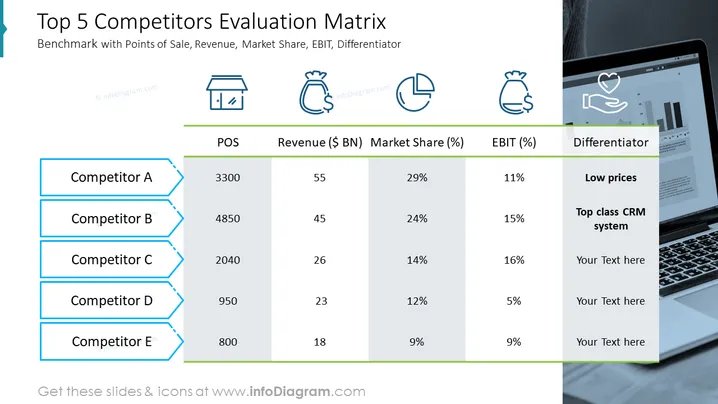
La diapositive est intitulée "Matrice d'Évaluation des 5 Meilleurs Concurrents" et sert d'outil de référence, fournissant une analyse comparative des cinq principaux concurrents d'une entreprise. Elle liste les concurrents aux côtés de métriques clés telles que les Points de Vente (POS), le Chiffre d'Affaires en milliards, le pourcentage de Part de Marché, le pourcentage d'EBIT, et une colonne pour les Différenciateurs, qui pourraient inclure des points de vente uniques comme 'Prix bas' ou un 'Système CRM de premier ordre'.
Dans l'ensemble, la diapositive a un aspect net et organisé, utilisant un schéma de couleurs bleu et vert pour catégoriser et mettre en valeur les données. Les icônes ajoutent un élément visuel pour aider à identifier rapidement les métriques.
Cette diapositive serait idéale pour :




