Your graphics add a nice touch to my presentations and I recently used them for one of my all-hands meetings. Your toolbox adds professionalism to my slides. Instead of using standard clipart.
Claude Jones, Director of Engineer, @Walmartlabs, USA
Your graphics add a nice touch to my presentations and I recently used them for one of my all-hands meetings. Your toolbox adds professionalism to my slides. Instead of using standard clipart.
Claude Jones, Director of Engineer, @Walmartlabs, USA
I needed a fresh look at some of my slides. I've tried to find a way to create a paintbrush effect, to underline, accentuate, add some color and the handwritten markers were just the things. Very easy to use, easy to size, change the color. It was an affordable, perfect solution and I'm happy to recommend it.
Anonymous, US
The crisp, clean look of the graphics, and the fact that it allowed me to easily edit and change the colors to match the template was my main reason for purchasing them.
Brandie Jenkins, E-learning Developer, USA
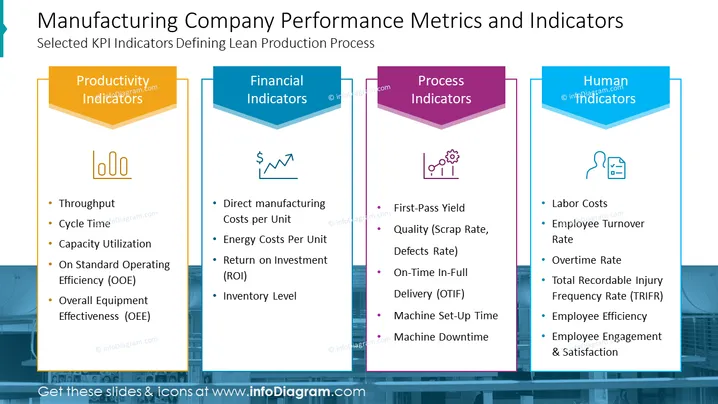
The slide is presenting different categories of key performance indicators (KPIs) for assessing a manufacturing company's efficiency. These categories are Productivity Indicators, Financial Indicators, Process Indicators, and Human Indicators. Each category is broken down into specific metrics. For example, Productivity Indicators encompass Throughput and Cycle Time, which measure the rate of production and the time taken for a process, respectively. Financial Indicators consider factors like Direct Manufacturing Costs per Unit and Return on Investment (ROI), relating to the cost-efficiency and financial returns of operations. Process Indicators such as First-Pass Yield and Machine Downtime focus on production quality and equipment efficiency. Lastly, Human Indicators include Labor Costs and Employee Turnover Rate, addressing the human aspect of the operation.
The slide design is sleek and corporate, using a color-coded system to distinguish the different KPI categories, making it visually organized and easy to follow. The use of simple icons helps to quickly associate each section with its respective focus area.


