

Your graphics add a nice touch to my presentations and I recently used them for one of my all-hands meetings. Your toolbox adds professionalism to my slides. Instead of using standard clipart.
Claude Jones, Director of Engineer, @Walmartlabs, USA

Your graphics add a nice touch to my presentations and I recently used them for one of my all-hands meetings. Your toolbox adds professionalism to my slides. Instead of using standard clipart.
Claude Jones, Director of Engineer, @Walmartlabs, USA
I needed a fresh look at some of my slides. I've tried to find a way to create a paintbrush effect, to underline, accentuate, add some color and the handwritten markers were just the things. Very easy to use, easy to size, change the color. It was an affordable, perfect solution and I'm happy to recommend it.
Anonymous, US
The crisp, clean look of the graphics, and the fact that it allowed me to easily edit and change the colors to match the template was my main reason for purchasing them.
Brandie Jenkins, E-learning Developer, USA
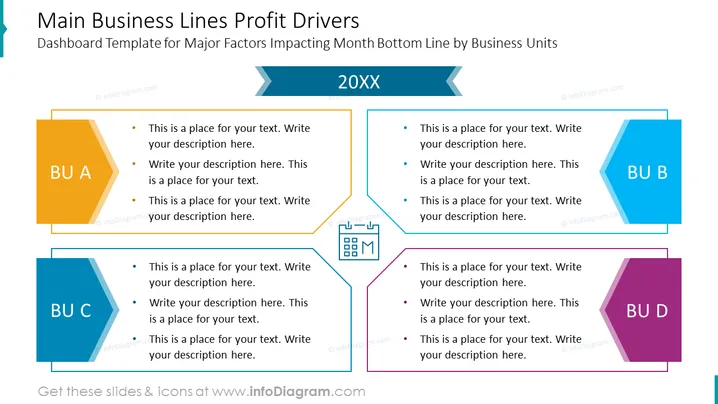
La diapositive PowerPoint intitulée « Facteurs de profit des principales lignes d'activité » est un modèle de tableau de bord conçu pour illustrer les principaux facteurs qui impactent le résultat net du mois par unité commerciale. Elle contient quatre sections distinctes intitulées « BU A », « BU B », « BU C » et « BU D », chacune avec trois puces où des descriptions personnalisables peuvent être insérées. Ces sections pourraient représenter différents départements ou gammes de produits au sein d'une entreprise, et les puces permettent une explication détaillée de la façon dont chaque unité commerciale contribue à la rentabilité globale.
L'aspect général de la diapositive est épuré et moderne, utilisant des formes géométriques et une variété de couleurs pour créer une segmentation visuellement attrayante de l'information. Elle est bien organisée, ce qui facilite la distinction entre les différents segments représentés par chaque unité commerciale.



