Your graphics add a nice touch to my presentations and I recently used them for one of my all-hands meetings. Your toolbox adds professionalism to my slides. Instead of using standard clipart.
Claude Jones, Director of Engineer, @Walmartlabs, USA
Your graphics add a nice touch to my presentations and I recently used them for one of my all-hands meetings. Your toolbox adds professionalism to my slides. Instead of using standard clipart.
Claude Jones, Director of Engineer, @Walmartlabs, USA
I needed a fresh look at some of my slides. I've tried to find a way to create a paintbrush effect, to underline, accentuate, add some color and the handwritten markers were just the things. Very easy to use, easy to size, change the color. It was an affordable, perfect solution and I'm happy to recommend it.
Anonymous, US
The crisp, clean look of the graphics, and the fact that it allowed me to easily edit and change the colors to match the template was my main reason for purchasing them.
Brandie Jenkins, E-learning Developer, USA
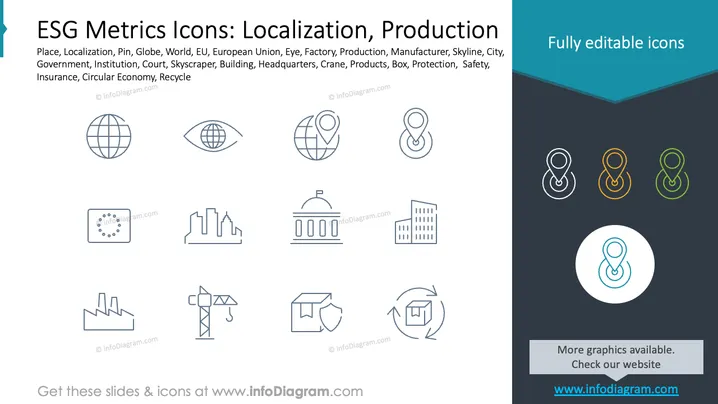
Cette diapositive présente divers icônes liés aux métriques ESG (Environnemental, Social et Gouvernance) axés sur la localisation et la production. Les concepts clés illustrés incluent : Lieu et Localisation (dépictant des identifiants spécifiques à un emplacement), Globe et Monde (présence et connectivité mondiales), UE (membre de l'Union Européenne), Œil (surveillance ou contrôle), Usine et Fabricant (processus de production industrielle), Horizon et Ville (développement urbain et infrastructures), Grue (construction), Produits et Boîte (marchandises et chaîne d'approvisionnement), Protection et Sécurité (mesures de sécurité), Économie Circulaire et Recyclage (durabilité et réutilisation des ressources).
L'apparence globale est nette et professionnelle, axée sur la clarté des icônes et leur utilité pour représenter visuellement diverses métriques ESG. Le design communique efficacement les concepts techniques.


