Your graphics add a nice touch to my presentations and I recently used them for one of my all-hands meetings. Your toolbox adds professionalism to my slides. Instead of using standard clipart.
Claude Jones, Director of Engineer, @Walmartlabs, USA
Your graphics add a nice touch to my presentations and I recently used them for one of my all-hands meetings. Your toolbox adds professionalism to my slides. Instead of using standard clipart.
Claude Jones, Director of Engineer, @Walmartlabs, USA
I needed a fresh look at some of my slides. I've tried to find a way to create a paintbrush effect, to underline, accentuate, add some color and the handwritten markers were just the things. Very easy to use, easy to size, change the color. It was an affordable, perfect solution and I'm happy to recommend it.
Anonymous, US
The crisp, clean look of the graphics, and the fact that it allowed me to easily edit and change the colors to match the template was my main reason for purchasing them.
Brandie Jenkins, E-learning Developer, USA
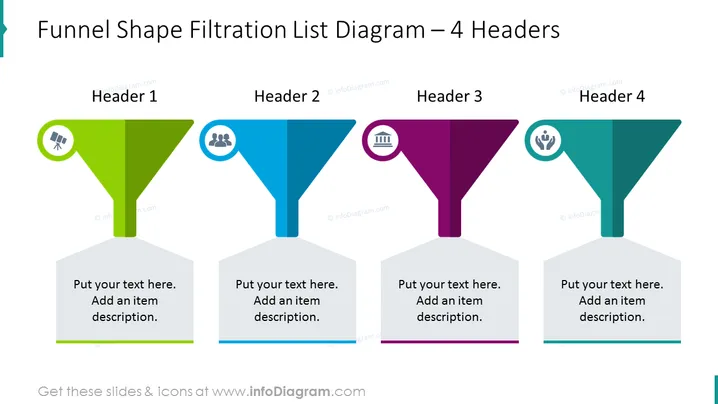
La diapositive représente un diagramme en forme d'entonnoir avec quatre étapes, représentées par des en-têtes distincts. Chaque en-tête est codé par couleur et comprend une icône au sommet de l'entonnoir qui correspond au thème de l'étape. "En-tête 1" en vert signale la phase initiale et fait allusion à un processus analytique avec son icône de graphique à barres. "En-tête 2" est en bleu, indiquant la deuxième étape avec une icône de groupe de personnes, signalant probablement un aspect collaboratif ou démographique. Ensuite, "En-tête 3" en violet a une icône de bâtiments symbolisant un niveau organisationnel ou structurel. Enfin, "En-tête 4" en turquoise a une icône représentant le leadership ou le travail d'équipe. Chaque entonnoir est relié à une zone de texte pour élaborer sur l'élément ou l'étape spécifique.


