

Your graphics add a nice touch to my presentations and I recently used them for one of my all-hands meetings. Your toolbox adds professionalism to my slides. Instead of using standard clipart.
Claude Jones, Director of Engineer, @Walmartlabs, USA

Your graphics add a nice touch to my presentations and I recently used them for one of my all-hands meetings. Your toolbox adds professionalism to my slides. Instead of using standard clipart.
Claude Jones, Director of Engineer, @Walmartlabs, USA
I needed a fresh look at some of my slides. I've tried to find a way to create a paintbrush effect, to underline, accentuate, add some color and the handwritten markers were just the things. Very easy to use, easy to size, change the color. It was an affordable, perfect solution and I'm happy to recommend it.
Anonymous, US
The crisp, clean look of the graphics, and the fact that it allowed me to easily edit and change the colors to match the template was my main reason for purchasing them.
Brandie Jenkins, E-learning Developer, USA
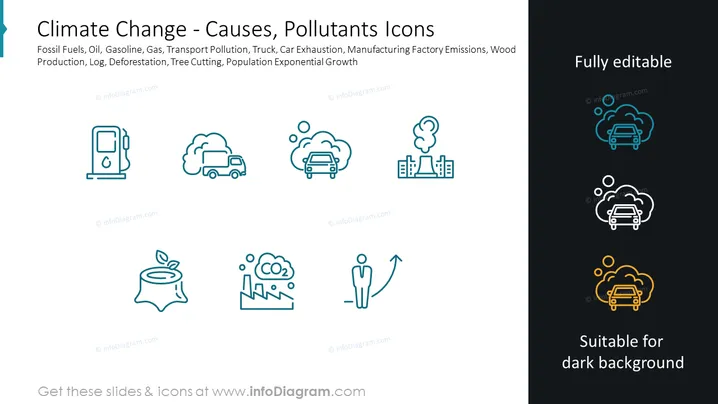
La diapositive présente une série d'icônes représentant diverses causes et polluants contribuant au changement climatique. Ces icônes symbolisent différentes sources d'émissions telles que les combustibles fossiles, le transport, et la déforestation. Les sources sont listées : Combustibles fossiles, Pétrole, Essence, Gaz, Pollution des Transports, Camion, Échappement de Voiture, Émissions des Usines, Production de Bois, Bûche, Déforestation, Abattage d'Arbres, et Croissance Exponentielle de la Population. Ces termes élargissent sur les facteurs induits par l'homme qui aggravent les concentrations de gaz à effet de serre et impactent par la suite les motifs climatiques globaux.
Le design visuel global est épuré et moderne, utilisant des couleurs contrastées pour mettre en évidence que les icônes sont adaptables à différentes couleurs de fond. Les icônes sont simplistes de manière à permettre une reconnaissance immédiate des différentes causes et polluants liés au changement climatique.



