Your graphics add a nice touch to my presentations and I recently used them for one of my all-hands meetings. Your toolbox adds professionalism to my slides. Instead of using standard clipart.
Claude Jones, Director of Engineer, @Walmartlabs, USA
Your graphics add a nice touch to my presentations and I recently used them for one of my all-hands meetings. Your toolbox adds professionalism to my slides. Instead of using standard clipart.
Claude Jones, Director of Engineer, @Walmartlabs, USA
I needed a fresh look at some of my slides. I've tried to find a way to create a paintbrush effect, to underline, accentuate, add some color and the handwritten markers were just the things. Very easy to use, easy to size, change the color. It was an affordable, perfect solution and I'm happy to recommend it.
Anonymous, US
The crisp, clean look of the graphics, and the fact that it allowed me to easily edit and change the colors to match the template was my main reason for purchasing them.
Brandie Jenkins, E-learning Developer, USA
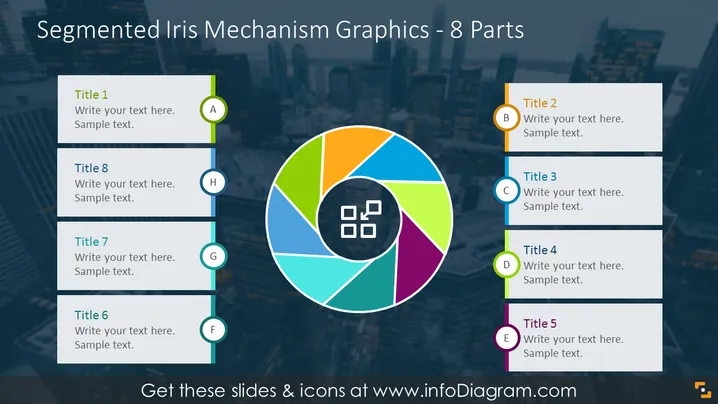
La diapositive présente un graphique d'un mécanisme d'iris segmenté divisé en 8 parties égales, où chaque segment représente un composant différent pouvant être étiqueté et décrit. Les titres 1 à 8 sont fournis pour chaque segment avec un espace réservé pour un texte supplémentaire expliquant chaque aspect. Les segments sont visuellement connectés par un arrangement circulaire, démontrant la nature interdépendante des composants, impliquant que chaque segment est une partie cruciale d'un système ou processus global.
L'apparence générale de la diapositive est dynamique et organisée, avec une distribution équilibrée des couleurs et des éléments qui guident l'œil du spectateur à travers le diagramme. La logique du design suggère une segmentation claire et une connectivité entre les parties d'un système ou concept.


