Your graphics add a nice touch to my presentations and I recently used them for one of my all-hands meetings. Your toolbox adds professionalism to my slides. Instead of using standard clipart.
Claude Jones, Director of Engineer, @Walmartlabs, USA
Your graphics add a nice touch to my presentations and I recently used them for one of my all-hands meetings. Your toolbox adds professionalism to my slides. Instead of using standard clipart.
Claude Jones, Director of Engineer, @Walmartlabs, USA
I needed a fresh look at some of my slides. I've tried to find a way to create a paintbrush effect, to underline, accentuate, add some color and the handwritten markers were just the things. Very easy to use, easy to size, change the color. It was an affordable, perfect solution and I'm happy to recommend it.
Anonymous, US
The crisp, clean look of the graphics, and the fact that it allowed me to easily edit and change the colors to match the template was my main reason for purchasing them.
Brandie Jenkins, E-learning Developer, USA
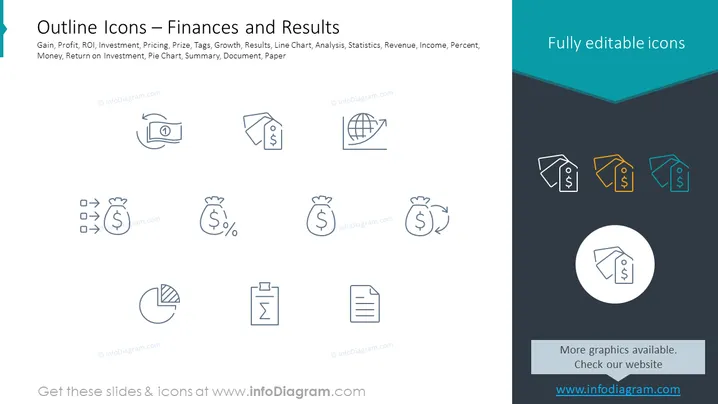
La diapositive PowerPoint intitulée "Icônes de Synthèse – Finances et Résultats" présente une collection d'icônes liées aux finances qui représentent divers concepts commerciaux : Gain, Profit, ROI (Retour sur Investissement), Investissement, Tarification, Prix, Étiquettes, Croissance, Résultats, Graphique Linéaire, Analyse, Statistiques, Revenus, Revenu, Pourcentage, Argent, Retour sur Investissement, Graphique en Secteurs, Résumé, Document et Papier. Chaque icône est une représentation visuelle de ces concepts, conçue pour rendre les diapositives plus claires et plus engageantes en simplifiant des sujets financiers complexes en symboles compréhensibles.
L'aspect général de la diapositive est propre et professionnel, avec un bon équilibre entre espace et informations. L'utilisation des couleurs met en valeur des éléments sélectifs sans submerger le spectateur.


