Your graphics add a nice touch to my presentations and I recently used them for one of my all-hands meetings. Your toolbox adds professionalism to my slides. Instead of using standard clipart.
Claude Jones, Director of Engineer, @Walmartlabs, USA
Your graphics add a nice touch to my presentations and I recently used them for one of my all-hands meetings. Your toolbox adds professionalism to my slides. Instead of using standard clipart.
Claude Jones, Director of Engineer, @Walmartlabs, USA
I needed a fresh look at some of my slides. I've tried to find a way to create a paintbrush effect, to underline, accentuate, add some color and the handwritten markers were just the things. Very easy to use, easy to size, change the color. It was an affordable, perfect solution and I'm happy to recommend it.
Anonymous, US
The crisp, clean look of the graphics, and the fact that it allowed me to easily edit and change the colors to match the template was my main reason for purchasing them.
Brandie Jenkins, E-learning Developer, USA
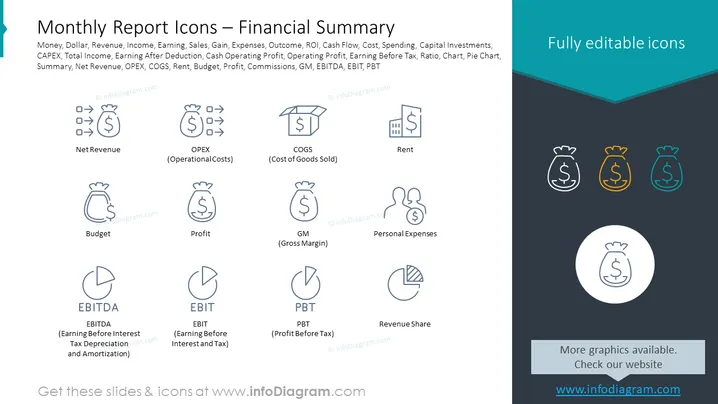
La diapositive présente une collection d'icônes financières représentant divers indicateurs et termes financiers clés tels que le Chiffre d'Affaires Net, OPEX (Coûts Opérationnels), COGS (Coût des Ventes), Loyer, Budget, Profit, MG (Marge Brute), Dépenses Personnelles, EBITDA (Bénéfice Avant Intérêts, Impôts, Amortissements et Dépréciations), EBIT (Bénéfice Avant Intérêts et Impôts) et PBT (Profit Avant Impôts). Chaque icône est accompagnée d'une étiquette expliquant brièvement le terme, pouvant servir de référence visuelle rapide pour ces concepts financiers dans des rapports et des présentations.
L'aspect général de la diapositive est très moderne et professionnel, mettant l'accent sur la clarté et la compréhension facile. L'utilisation de la couleur est maîtrisée, avec des accents utilisés pour souligner la nature modifiable des icônes.


