

Your graphics add a nice touch to my presentations and I recently used them for one of my all-hands meetings. Your toolbox adds professionalism to my slides. Instead of using standard clipart.
Claude Jones, Director of Engineer, @Walmartlabs, USA

Your graphics add a nice touch to my presentations and I recently used them for one of my all-hands meetings. Your toolbox adds professionalism to my slides. Instead of using standard clipart.
Claude Jones, Director of Engineer, @Walmartlabs, USA
I needed a fresh look at some of my slides. I've tried to find a way to create a paintbrush effect, to underline, accentuate, add some color and the handwritten markers were just the things. Very easy to use, easy to size, change the color. It was an affordable, perfect solution and I'm happy to recommend it.
Anonymous, US
The crisp, clean look of the graphics, and the fact that it allowed me to easily edit and change the colors to match the template was my main reason for purchasing them.
Brandie Jenkins, E-learning Developer, USA
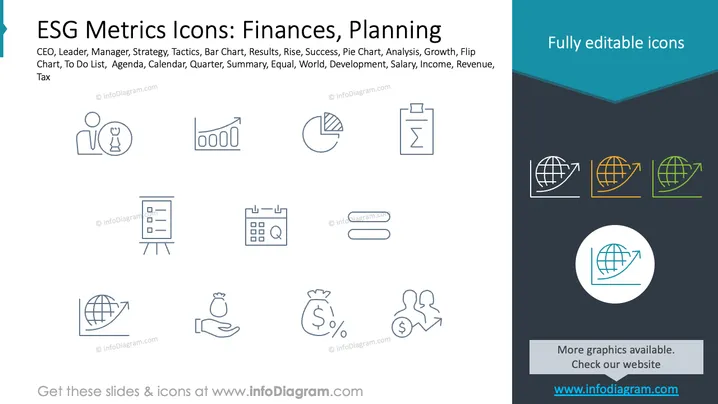
Cette diapositive propose une collection d'icônes liées aux métriques ESG, en mettant l'accent sur les aspects financiers et de planification. Elle comprend des symboles pour PDG, Leader, Manager, mettant en avant les rôles dans les affaires. Des icônes comme Stratégie et Tactiques représentent des méthodologies de planification. Graphique à Barres, Graphique Circulaire, et Analyse indiquent la visualisation et l'examen des données. Croissance et Succès incarnent la progression des affaires, tandis que Calendrier et Agenda aident à la planification. Résumé, Monde et Développement indiquent des rapports globaux ou des aperçus de projets. Enfin, Impôt et Revenus sont des éléments fiscaux clés.
L'apparence générale est propre et professionnelle, conçue pour la clarté et la facilité de compréhension. L'utilisation d'icônes minimalistes améliore la compréhension sans submerger le spectateur.



