

Your graphics add a nice touch to my presentations and I recently used them for one of my all-hands meetings. Your toolbox adds professionalism to my slides. Instead of using standard clipart.
Claude Jones, Director of Engineer, @Walmartlabs, USA

Your graphics add a nice touch to my presentations and I recently used them for one of my all-hands meetings. Your toolbox adds professionalism to my slides. Instead of using standard clipart.
Claude Jones, Director of Engineer, @Walmartlabs, USA
I needed a fresh look at some of my slides. I've tried to find a way to create a paintbrush effect, to underline, accentuate, add some color and the handwritten markers were just the things. Very easy to use, easy to size, change the color. It was an affordable, perfect solution and I'm happy to recommend it.
Anonymous, US
The crisp, clean look of the graphics, and the fact that it allowed me to easily edit and change the colors to match the template was my main reason for purchasing them.
Brandie Jenkins, E-learning Developer, USA
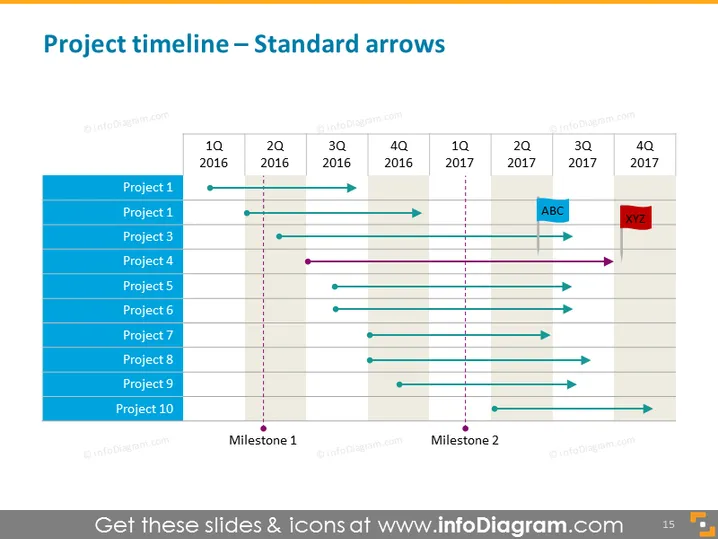
La diapositive PowerPoint présente une "Chronologie du projet" utilisant des flèches standards pour représenter la durée et les phases de divers projets sur une période de deux ans, de 2016 à 2017. Chaque projet est listé le long de l'axe vertical, avec dix projets affichés. L'axe horizontal représente le temps, divisé en trimestres (T1 à T4) pour chaque année. Des repères étiquetés "Événement 1" et "Événement 2" signifient des points ou événements clés. Certains projets commencent et se terminent dans la même année, tandis que d'autres s'étendent sur les deux années, se terminant par un point de flèche.
La conception de la diapositive est épurée et professionnelle, avec une mise en page simple facile à suivre. L'utilisation de la couleur distingue efficacement les différents éléments et attire l'attention sur les points importants de la chronologie.



