Your graphics add a nice touch to my presentations and I recently used them for one of my all-hands meetings. Your toolbox adds professionalism to my slides. Instead of using standard clipart.
Claude Jones, Director of Engineer, @Walmartlabs, USA
Your graphics add a nice touch to my presentations and I recently used them for one of my all-hands meetings. Your toolbox adds professionalism to my slides. Instead of using standard clipart.
Claude Jones, Director of Engineer, @Walmartlabs, USA
I needed a fresh look at some of my slides. I've tried to find a way to create a paintbrush effect, to underline, accentuate, add some color and the handwritten markers were just the things. Very easy to use, easy to size, change the color. It was an affordable, perfect solution and I'm happy to recommend it.
Anonymous, US
The crisp, clean look of the graphics, and the fact that it allowed me to easily edit and change the colors to match the template was my main reason for purchasing them.
Brandie Jenkins, E-learning Developer, USA
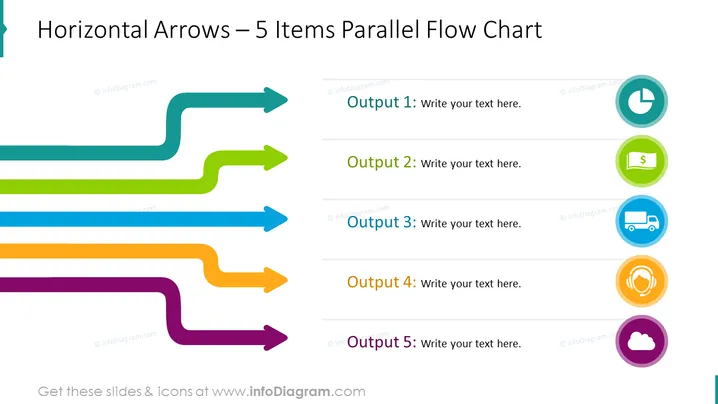
La diapositive présente un diagramme de flux intitulé "Flèches Horizontales – 5 Éléments Diagramme de Flux Parallèle". Il comporte cinq flèches horizontales de différentes couleurs pointant vers la droite, chacune représentant un résultat séquentiel allant de Résultat 1 à Résultat 5. À côté de chaque flèche se trouve un espace réservé pour du texte, suggérant que l'utilisateur peut saisir des détails ou des descriptions pertinents pour chaque résultat. Chaque résultat est associé à une icône circulaire distincte à l'extrême droite, impliquant une association graphique, pouvant désigner la nature ou la catégorie du résultat.
L'apparence générale de la diapositive est moderne et professionnelle, utilisant le codage couleur pour organiser efficacement l'information. L'utilisation de représentations iconiques aide à la communication visuelle du contenu de la diapositive.


