Your graphics add a nice touch to my presentations and I recently used them for one of my all-hands meetings. Your toolbox adds professionalism to my slides. Instead of using standard clipart.
Claude Jones, Director of Engineer, @Walmartlabs, USA
Your graphics add a nice touch to my presentations and I recently used them for one of my all-hands meetings. Your toolbox adds professionalism to my slides. Instead of using standard clipart.
Claude Jones, Director of Engineer, @Walmartlabs, USA
I needed a fresh look at some of my slides. I've tried to find a way to create a paintbrush effect, to underline, accentuate, add some color and the handwritten markers were just the things. Very easy to use, easy to size, change the color. It was an affordable, perfect solution and I'm happy to recommend it.
Anonymous, US
The crisp, clean look of the graphics, and the fact that it allowed me to easily edit and change the colors to match the template was my main reason for purchasing them.
Brandie Jenkins, E-learning Developer, USA
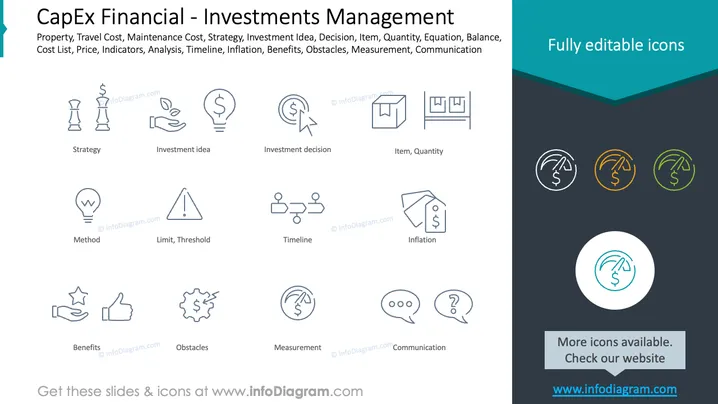
La diapositive présente une collection de symboles et d'expressions associés à la gestion financière des dépenses d'investissement et à la gestion des investissements. L'éventail des sujets couvre la « Stratégie », qui signifie la planification de l'approche des investissements, l'« Idée d'investissement » suggérant un concept d'investissement, la « Décision d'investissement » indiquant le choix final concernant une opportunité d'investissement, et l'« Inflation », qui est l'augmentation générale du niveau des prix et la réduction du pouvoir d'achat. Elle comprend des concepts procéduraux tels que la « Méthode » et le « Calendrier », ainsi que des considérations évaluatives telles que les « Avantages », les « Obstacles » et la « Mesure ». Il y a également des références à la « Communication », soulignant l'importance de l'échange d'informations, et à la « Limite, Seuil », faisant allusion à l'établissement de limites ou de critères pour les actions.
La diapositive a un aspect moderne et épuré avec une iconographie cohérente. Elle présente les informations de manière visuellement attrayante en utilisant des graphiques simples et un texte limité, ce qui facilite la compréhension.


