

Your graphics add a nice touch to my presentations and I recently used them for one of my all-hands meetings. Your toolbox adds professionalism to my slides. Instead of using standard clipart.
Claude Jones, Director of Engineer, @Walmartlabs, USA

Your graphics add a nice touch to my presentations and I recently used them for one of my all-hands meetings. Your toolbox adds professionalism to my slides. Instead of using standard clipart.
Claude Jones, Director of Engineer, @Walmartlabs, USA
I needed a fresh look at some of my slides. I've tried to find a way to create a paintbrush effect, to underline, accentuate, add some color and the handwritten markers were just the things. Very easy to use, easy to size, change the color. It was an affordable, perfect solution and I'm happy to recommend it.
Anonymous, US
The crisp, clean look of the graphics, and the fact that it allowed me to easily edit and change the colors to match the template was my main reason for purchasing them.
Brandie Jenkins, E-learning Developer, USA
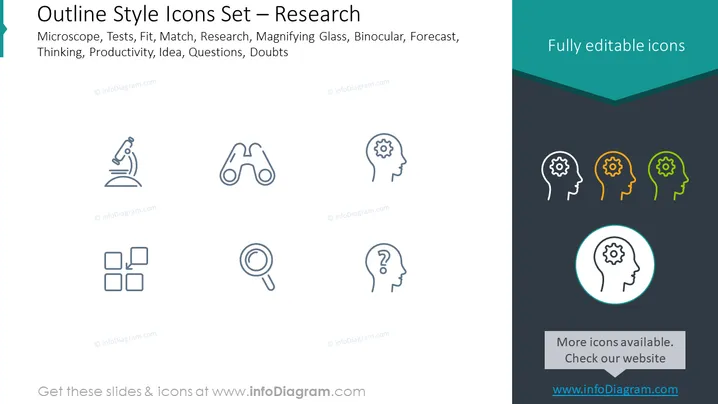
La diapositive présente une collection d'icônes au style contour liées aux processus de recherche et d'analyse. Les icônes sont censées représenter les concepts suivants : Microscope (enquête scientifique), Tests (évaluation ou expériences), Adaptation (adéquation ou compatibilité), Correspondance (trouver des similitudes ou des liens), Recherche (enquête systématique pour découvrir de nouvelles informations), Loupe (examen de plus près), Jumelles (vision améliorée ou prévoyance), Prévision (prédire les tendances futures), Pensée (processus cognitifs), Productivité (efficacité dans la production de résultats), Idée (pensée conceptuelle ou innovation), Questions (enquête pour obtenir des informations) et Doutes (incertitude ou scepticisme).
La diapositive a un design épuré et moderne avec une apparence professionnelle. L'utilisation d'icônes en contour fournit une simplicité visuelle et aide à transmettre efficacement le thème de la recherche et de l'analyse.



