
Your graphics add a nice touch to my presentations and I recently used them for one of my all-hands meetings. Your toolbox adds professionalism to my slides. Instead of using standard clipart.
Claude Jones, Director of Engineer, @Walmartlabs, USA

Your graphics add a nice touch to my presentations and I recently used them for one of my all-hands meetings. Your toolbox adds professionalism to my slides. Instead of using standard clipart.
Claude Jones, Director of Engineer, @Walmartlabs, USA

I needed a fresh look at some of my slides. I've tried to find a way to create a paintbrush effect, to underline, accentuate, add some color and the handwritten markers were just the things. Very easy to use, easy to size, change the color. It was an affordable, perfect solution and I'm happy to recommend it.
Anonymous, US
The crisp, clean look of the graphics, and the fact that it allowed me to easily edit and change the colors to match the template was my main reason for purchasing them.
Brandie Jenkins, E-learning Developer, USA
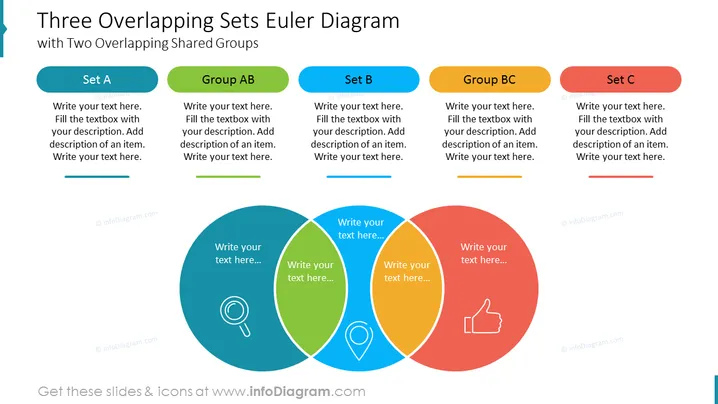
La diapositive PowerPoint intitulée "Diagramme d'Euler à Trois Ensembles Chevauchants avec Deux Groupes Partagés Chevauchants" illustre un concept à travers trois formes circulaires interconnectées représentant les ensembles A, B et C, et leurs zones de chevauchement étiquetées comme groupes AB et BC. "Ensemble A" et "Ensemble C" sont des entités singulières, tandis que "Groupe AB" et "Groupe BC" sont des intersections indiquant des éléments partagés entre les ensembles. Chaque section d'ensemble et de groupe offre un espace pour écrire du texte, permettant des descriptions détaillées et un développement sur les traits ou éléments particuliers appartenant à chaque catégorie.
La diapositive utilise un schéma de couleurs propre et professionnel et est soigneusement organisée pour souligner les relations entre différents groupes de manière visuelle et intuitive.


