

Your graphics add a nice touch to my presentations and I recently used them for one of my all-hands meetings. Your toolbox adds professionalism to my slides. Instead of using standard clipart.
Claude Jones, Director of Engineer, @Walmartlabs, USA

Your graphics add a nice touch to my presentations and I recently used them for one of my all-hands meetings. Your toolbox adds professionalism to my slides. Instead of using standard clipart.
Claude Jones, Director of Engineer, @Walmartlabs, USA
I needed a fresh look at some of my slides. I've tried to find a way to create a paintbrush effect, to underline, accentuate, add some color and the handwritten markers were just the things. Very easy to use, easy to size, change the color. It was an affordable, perfect solution and I'm happy to recommend it.
Anonymous, US
The crisp, clean look of the graphics, and the fact that it allowed me to easily edit and change the colors to match the template was my main reason for purchasing them.
Brandie Jenkins, E-learning Developer, USA
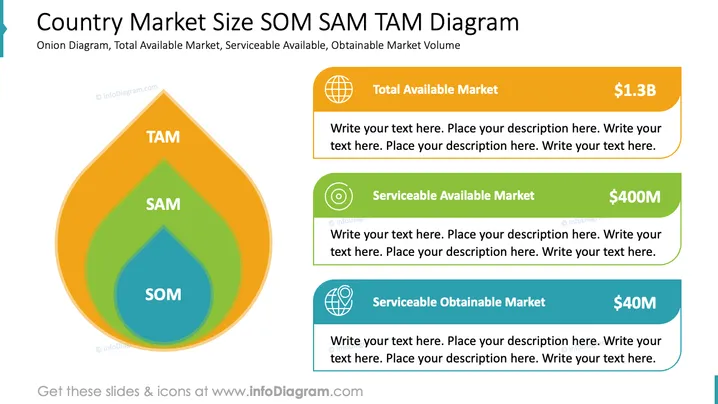
La diapositive illustre le cadre de taille du marché en utilisant un diagramme en oignon. Elle explique trois concepts clés : le Marché Total Disponible (TAM) représentant la demande globale pour un produit ou un service (1,3 milliard de dollars), le Marché Disponible Servi (SAM) représentant le segment du TAM ciblé par les produits d'une entreprise (400 millions de dollars), et le Marché Obtenable Servi (SOM) indiquant la portion du SAM qui peut être capturée de manière réaliste (40 millions de dollars).
La diapositive utilise un schéma de couleurs visuellement attrayant et une conception systématique pour transmettre efficacement les différents segments de marché de manière claire. L'utilisation d'icônes et de chiffres numérotés améliore la compréhension du cadre complexe de taille du marché.



