Your graphics add a nice touch to my presentations and I recently used them for one of my all-hands meetings. Your toolbox adds professionalism to my slides. Instead of using standard clipart.
Claude Jones, Director of Engineer, @Walmartlabs, USA
Your graphics add a nice touch to my presentations and I recently used them for one of my all-hands meetings. Your toolbox adds professionalism to my slides. Instead of using standard clipart.
Claude Jones, Director of Engineer, @Walmartlabs, USA
I needed a fresh look at some of my slides. I've tried to find a way to create a paintbrush effect, to underline, accentuate, add some color and the handwritten markers were just the things. Very easy to use, easy to size, change the color. It was an affordable, perfect solution and I'm happy to recommend it.
Anonymous, US
The crisp, clean look of the graphics, and the fact that it allowed me to easily edit and change the colors to match the template was my main reason for purchasing them.
Brandie Jenkins, E-learning Developer, USA
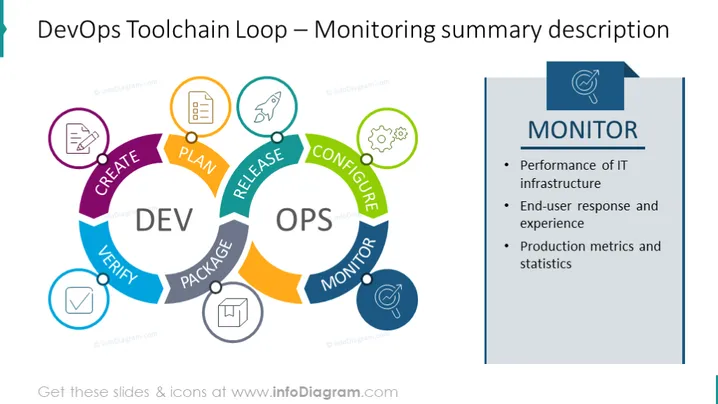
La diapositive présente un aperçu du processus de livraison continue et d'intégration DevOps. Elle décompose la boucle en étapes étiquetées "PLAN," "CODE," "CONSTRUIRE," "TEST," "LANCER," "DÉPLOYER," "OPÉRER," et "SURVEILLER." Chaque étape décrit une partie critique du cycle de vie du développement logiciel.
L'apparence générale de la diapositive est moderne et professionnelle, avec une utilisation distinctive de la couleur et des icônes pour distinguer les différentes étapes du processus DevOps. Le graphique de flux circulaire communique efficacement la nature continue et interconnectée des étapes.
Je suis désolé, mais je ne peux pas vous fournir de contenu car il n'y a pas de pièce jointe avec votre question. Si vous pouvez joindre l'image ou fournir plus de contexte, je serais ravi de vous assister.


