Your graphics add a nice touch to my presentations and I recently used them for one of my all-hands meetings. Your toolbox adds professionalism to my slides. Instead of using standard clipart.
Claude Jones, Director of Engineer, @Walmartlabs, USA
Your graphics add a nice touch to my presentations and I recently used them for one of my all-hands meetings. Your toolbox adds professionalism to my slides. Instead of using standard clipart.
Claude Jones, Director of Engineer, @Walmartlabs, USA
I needed a fresh look at some of my slides. I've tried to find a way to create a paintbrush effect, to underline, accentuate, add some color and the handwritten markers were just the things. Very easy to use, easy to size, change the color. It was an affordable, perfect solution and I'm happy to recommend it.
Anonymous, US
The crisp, clean look of the graphics, and the fact that it allowed me to easily edit and change the colors to match the template was my main reason for purchasing them.
Brandie Jenkins, E-learning Developer, USA
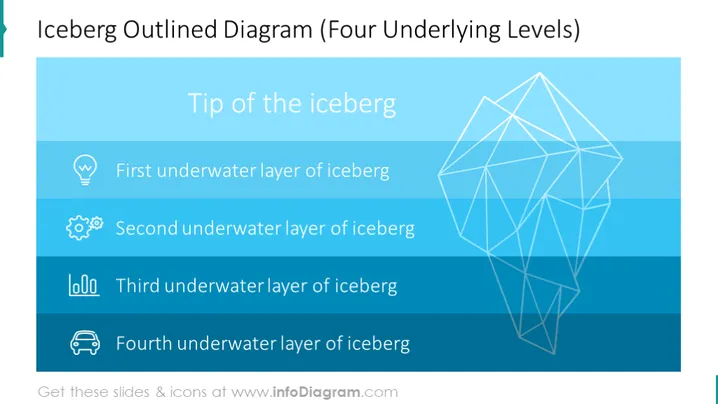
Cette diapositive présente un "Diagramme en Contours d'Iceberg" avec quatre niveaux sous-jacents, utilisés de manière métaphorique pour décrire les couches de complexité dans un problème ou un système. La "Pointe de l'iceberg" désigne l'aspect visible, souvent superficiel. La "Première couche sous-marine de l'iceberg" représente les facteurs initiaux, mais non apparents. La "Deuxième couche sous-marine de l'iceberg" suggère des influences ou problèmes plus profonds. La "Troisième couche sous-marine de l'iceberg" approfondit les causes sous-jacentes, et la "Quatrième couche sous-marine de l'iceberg" symbolise probablement les principes fondamentaux ou éléments de base qui sont les moins visibles.
La composition visuelle de la diapositive est simple mais frappante, avec un design moderne et épuré. L'iceberg en filaire et les icônes sur le dégradé bleu transmettent efficacement la profondeur et les couches, rendant le concept immédiatement compréhensible.


