Your graphics add a nice touch to my presentations and I recently used them for one of my all-hands meetings. Your toolbox adds professionalism to my slides. Instead of using standard clipart.
Claude Jones, Director of Engineer, @Walmartlabs, USA
Your graphics add a nice touch to my presentations and I recently used them for one of my all-hands meetings. Your toolbox adds professionalism to my slides. Instead of using standard clipart.
Claude Jones, Director of Engineer, @Walmartlabs, USA
I needed a fresh look at some of my slides. I've tried to find a way to create a paintbrush effect, to underline, accentuate, add some color and the handwritten markers were just the things. Very easy to use, easy to size, change the color. It was an affordable, perfect solution and I'm happy to recommend it.
Anonymous, US
The crisp, clean look of the graphics, and the fact that it allowed me to easily edit and change the colors to match the template was my main reason for purchasing them.
Brandie Jenkins, E-learning Developer, USA
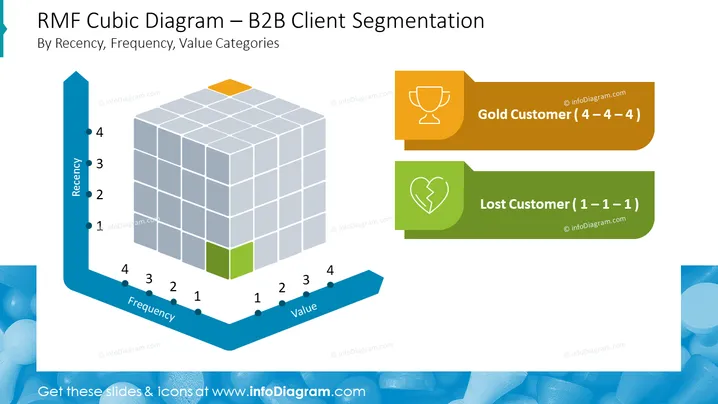
La diapositive introduit le concept de segmentation des clients B2B à l'aide d'un Diagramme Cubique RMF (Récence, Fréquence, Valeur). C'est une méthode utilisée pour catégoriser les clients en fonction de trois métriques : à quelle fréquence ils ont effectué un achat (Récence), à quelle fréquence ils achètent (Fréquence), et la valeur monétaire de leurs achats (Valeur). Deux exemples de classifications des clients sont donnés : "Client Or (4-4-4)," indiquant les clients de premier niveau sur les trois dimensions, et "Client Perdu (1-1-1)," représentant ceux qui obtiennent les scores les plus bas dans toutes les catégories.
La diapositive est épurée et visuellement frappante, utilisant la couleur et des graphiques 3D pour représenter efficacement des données complexes. Le balisage clair et la segmentation du diagramme aident à comprendre le concept de stratification des clients.


