

Your graphics add a nice touch to my presentations and I recently used them for one of my all-hands meetings. Your toolbox adds professionalism to my slides. Instead of using standard clipart.
Claude Jones, Director of Engineer, @Walmartlabs, USA

Your graphics add a nice touch to my presentations and I recently used them for one of my all-hands meetings. Your toolbox adds professionalism to my slides. Instead of using standard clipart.
Claude Jones, Director of Engineer, @Walmartlabs, USA
I needed a fresh look at some of my slides. I've tried to find a way to create a paintbrush effect, to underline, accentuate, add some color and the handwritten markers were just the things. Very easy to use, easy to size, change the color. It was an affordable, perfect solution and I'm happy to recommend it.
Anonymous, US
The crisp, clean look of the graphics, and the fact that it allowed me to easily edit and change the colors to match the template was my main reason for purchasing them.
Brandie Jenkins, E-learning Developer, USA
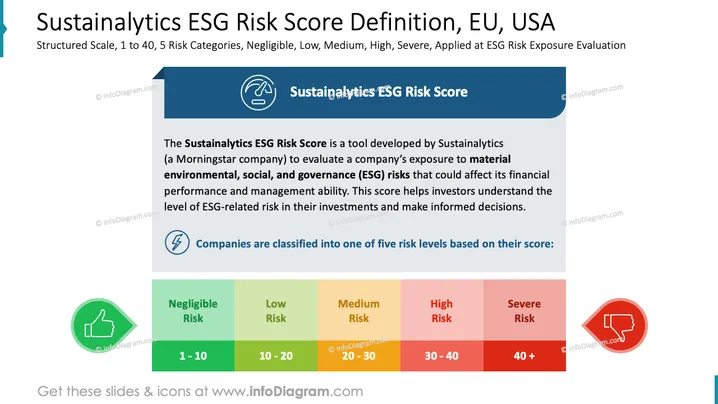
La diapositive présente le Score de Risque ESG de Sustainalytics, un outil de Sustainalytics (une entreprise de Morningstar), pour évaluer l'exposition d'une entreprise aux risques environnementaux, sociaux et de gouvernance (ESG). Le score évalue comment ces risques pourraient impacter la performance financière et la gestion. Il aide les investisseurs à comprendre les risques liés à l'ESG dans leurs investissements pour des choix éclairés. Les entreprises sont divisées en cinq catégories de risque : Négligeable (1-10), Faible (10-20), Moyen (20-30), Élevé (30-40) et Sévère (40+).
La diapositive utilise efficacement le code couleur pour différencier les niveaux de risque, ajoutant à la clarté et à l'impact. L'utilisation d'icônes améliore la compréhension, rendant le tout visuellement attrayant et informatif.



