

Your graphics add a nice touch to my presentations and I recently used them for one of my all-hands meetings. Your toolbox adds professionalism to my slides. Instead of using standard clipart.
Claude Jones, Director of Engineer, @Walmartlabs, USA

Your graphics add a nice touch to my presentations and I recently used them for one of my all-hands meetings. Your toolbox adds professionalism to my slides. Instead of using standard clipart.
Claude Jones, Director of Engineer, @Walmartlabs, USA
I needed a fresh look at some of my slides. I've tried to find a way to create a paintbrush effect, to underline, accentuate, add some color and the handwritten markers were just the things. Very easy to use, easy to size, change the color. It was an affordable, perfect solution and I'm happy to recommend it.
Anonymous, US
The crisp, clean look of the graphics, and the fact that it allowed me to easily edit and change the colors to match the template was my main reason for purchasing them.
Brandie Jenkins, E-learning Developer, USA
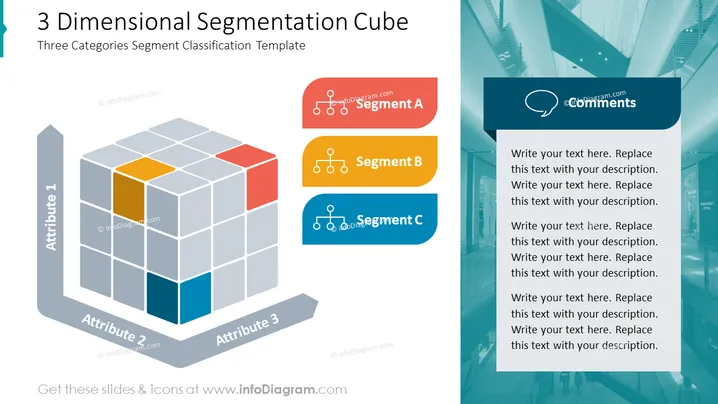
La diapositive présente un "Modèle de Classification de Segment en Trois Catégories" pour organiser ou classer des données en trois segments basés sur trois attributs. Un cube 3D est affiché, segmenté en divers blocs, chacun représentant un point de données. Il y a trois blocs colorés qui ressortent, représentant la segmentation en Segment A (rouge), Segment B (jaune) et Segment C (bleu). Chaque segment est détaillé par l'utilisation de symboles indiquant un groupe ou un ensemble, signifiant probablement un sous-ensemble de données ou une catégorie au sein de ce segment.
La diapositive a une apparence moderne et professionnelle, avec un design coordonné en couleurs qui utilise efficacement les formes et les couleurs pour différencier les éléments. Le cube 3D crée un point focal visuel engageant, tandis que les panneaux latéraux et les icônes fournissent des voies claires pour l'organisation et l'explication du contenu.



