

Your graphics add a nice touch to my presentations and I recently used them for one of my all-hands meetings. Your toolbox adds professionalism to my slides. Instead of using standard clipart.
Claude Jones, Director of Engineer, @Walmartlabs, USA

Your graphics add a nice touch to my presentations and I recently used them for one of my all-hands meetings. Your toolbox adds professionalism to my slides. Instead of using standard clipart.
Claude Jones, Director of Engineer, @Walmartlabs, USA
I needed a fresh look at some of my slides. I've tried to find a way to create a paintbrush effect, to underline, accentuate, add some color and the handwritten markers were just the things. Very easy to use, easy to size, change the color. It was an affordable, perfect solution and I'm happy to recommend it.
Anonymous, US
The crisp, clean look of the graphics, and the fact that it allowed me to easily edit and change the colors to match the template was my main reason for purchasing them.
Brandie Jenkins, E-learning Developer, USA
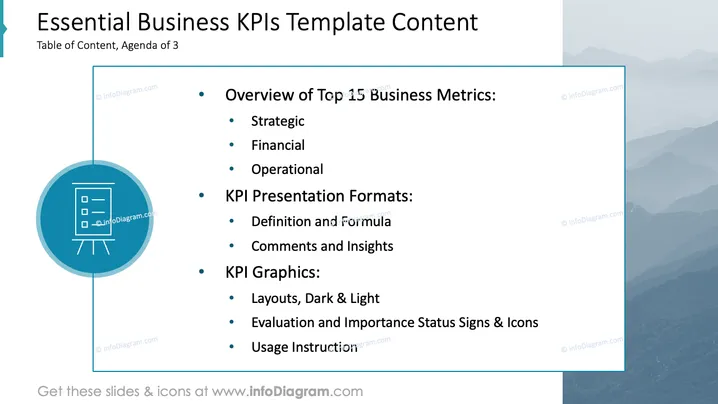
La diapositive fournit un aperçu des métriques commerciales, des formats et des graphiques pour les KPI. Les indicateurs clés incluent des objectifs stratégiques (objectifs de haut niveau), des indicateurs financiers (performance monétaire) et des indicateurs opérationnels (efficacité quotidienne). Les formats de présentation montrent comment afficher ces métriques en utilisant des définitions, des formules, des commentaires et des idées. Les graphiques KPI démontrent des outils visuels tels que des mises en page, des signes de statut et des instructions d'utilisation pour communiquer efficacement les données KPI.
L'apparence générale est professionnelle et organisée, idéale pour transmettre des informations structurées. L'utilisation d'icônes et d'accents de couleur améliore l'engagement visuel de la diapositive.



