
Your graphics add a nice touch to my presentations and I recently used them for one of my all-hands meetings. Your toolbox adds professionalism to my slides. Instead of using standard clipart.
Claude Jones, Director of Engineer, @Walmartlabs, USA
Your graphics add a nice touch to my presentations and I recently used them for one of my all-hands meetings. Your toolbox adds professionalism to my slides. Instead of using standard clipart.
Claude Jones, Director of Engineer, @Walmartlabs, USA
I needed a fresh look at some of my slides. I've tried to find a way to create a paintbrush effect, to underline, accentuate, add some color and the handwritten markers were just the things. Very easy to use, easy to size, change the color. It was an affordable, perfect solution and I'm happy to recommend it.
Anonymous, US
The crisp, clean look of the graphics, and the fact that it allowed me to easily edit and change the colors to match the template was my main reason for purchasing them.
Brandie Jenkins, E-learning Developer, USA
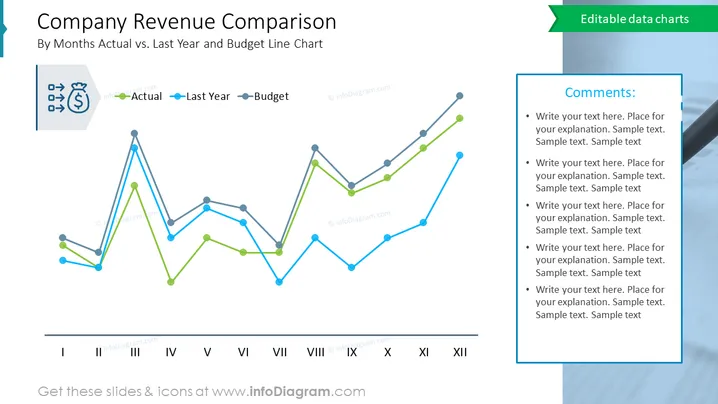
La diapositive est une représentation graphique de la comparaison des revenus mensuels d'une entreprise sur une année, traçant les revenus réels par rapport aux chiffres de l'année précédente et aux projections budgétaires. Le graphique linéaire fournit une comparaison claire mois par mois, illustrant les périodes de surperformance ou de sous-performance par rapport à l'année précédente et au budget. Cet outil visuel est crucial pour l'analyse financière, permettant une identification rapide des tendances, des impacts saisonniers et la nécessité d'ajustements budgétaires.
Dans l'ensemble, la diapositive a un design épuré et informatif, avec des lignes codées par couleur facilitant la différenciation des ensembles de données pour une analyse rapide.
Une telle diapositive serait utile dans :




