

Your graphics add a nice touch to my presentations and I recently used them for one of my all-hands meetings. Your toolbox adds professionalism to my slides. Instead of using standard clipart.
Claude Jones, Director of Engineer, @Walmartlabs, USA

Your graphics add a nice touch to my presentations and I recently used them for one of my all-hands meetings. Your toolbox adds professionalism to my slides. Instead of using standard clipart.
Claude Jones, Director of Engineer, @Walmartlabs, USA
I needed a fresh look at some of my slides. I've tried to find a way to create a paintbrush effect, to underline, accentuate, add some color and the handwritten markers were just the things. Very easy to use, easy to size, change the color. It was an affordable, perfect solution and I'm happy to recommend it.
Anonymous, US
The crisp, clean look of the graphics, and the fact that it allowed me to easily edit and change the colors to match the template was my main reason for purchasing them.
Brandie Jenkins, E-learning Developer, USA
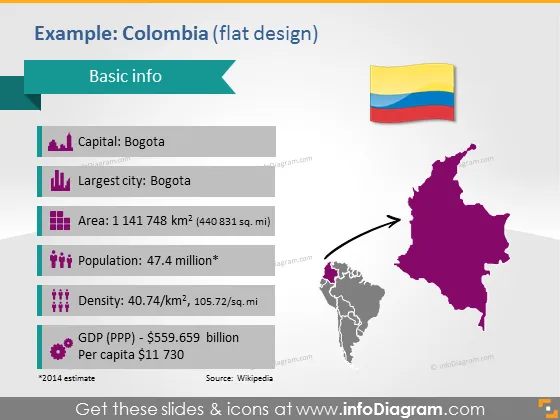
La diapositive PowerPoint est intitulée "Exemple : Colombie (design plat)" et contient des "Informations de base" sur la Colombie. Elle liste la capitale comme Bogotá, qui est également la plus grande ville. La surface est présentée comme 1 141 748 kilomètres carrés, soulignant l'immensité du pays. Elle note la population à 47,4 millions, mettant en avant un nombre significatif d'habitants. La densité de la population est spécifiée comme 40,74/km², fournissant une compréhension de la répartition de la population. De plus, elle détaille le PIB (PPA) comme étant de 559,659 milliards de dollars et un revenu par habitant de 11 730 dollars, pointant vers des indicateurs économiques.
La diapositive est structurée avec des informations claires et concises associées à des icônes et des cartes vibrantes pour fournir un accent visuel. Le design plat assure une apparence moderne et facilement lisible.



