Your graphics add a nice touch to my presentations and I recently used them for one of my all-hands meetings. Your toolbox adds professionalism to my slides. Instead of using standard clipart.
Claude Jones, Director of Engineer, @Walmartlabs, USA
Your graphics add a nice touch to my presentations and I recently used them for one of my all-hands meetings. Your toolbox adds professionalism to my slides. Instead of using standard clipart.
Claude Jones, Director of Engineer, @Walmartlabs, USA
I needed a fresh look at some of my slides. I've tried to find a way to create a paintbrush effect, to underline, accentuate, add some color and the handwritten markers were just the things. Very easy to use, easy to size, change the color. It was an affordable, perfect solution and I'm happy to recommend it.
Anonymous, US
The crisp, clean look of the graphics, and the fact that it allowed me to easily edit and change the colors to match the template was my main reason for purchasing them.
Brandie Jenkins, E-learning Developer, USA
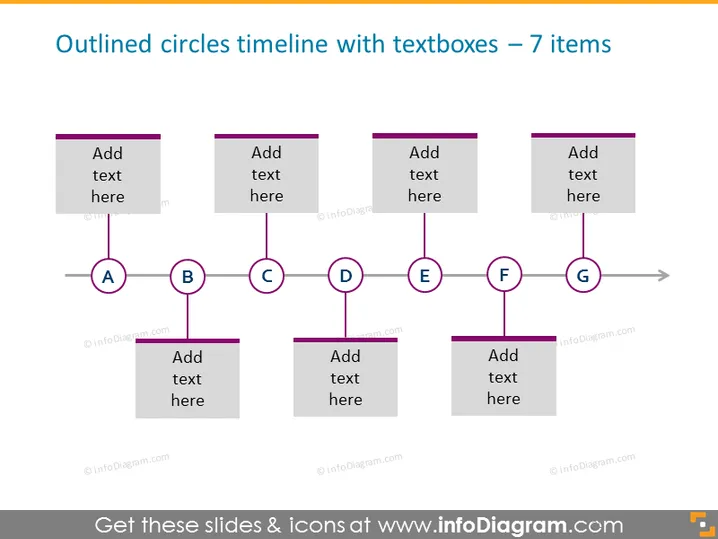
La diapositive présente une chronologie avec sept étapes, indiquées par des cercles délimités étiquetés de 'A' à 'G'. Chaque cercle est relié par une ligne horizontale qui suggère une séquence ou une progression dans le temps. Les cercles sont alignés horizontalement et placés au-dessus de leurs zones de texte correspondantes, qui incitent le présentateur à "Ajouter du texte ici". Cet agencement implique que chaque paire cercle et zone de texte représente une étape ou un événement distinct dans un processus ou une chronologie plus large. Chaque étape est destinée à détailler une partie spécifique d'un processus ou d'une séquence d'événements.


