Your graphics add a nice touch to my presentations and I recently used them for one of my all-hands meetings. Your toolbox adds professionalism to my slides. Instead of using standard clipart.
Claude Jones, Director of Engineer, @Walmartlabs, USA
Your graphics add a nice touch to my presentations and I recently used them for one of my all-hands meetings. Your toolbox adds professionalism to my slides. Instead of using standard clipart.
Claude Jones, Director of Engineer, @Walmartlabs, USA
I needed a fresh look at some of my slides. I've tried to find a way to create a paintbrush effect, to underline, accentuate, add some color and the handwritten markers were just the things. Very easy to use, easy to size, change the color. It was an affordable, perfect solution and I'm happy to recommend it.
Anonymous, US
The crisp, clean look of the graphics, and the fact that it allowed me to easily edit and change the colors to match the template was my main reason for purchasing them.
Brandie Jenkins, E-learning Developer, USA
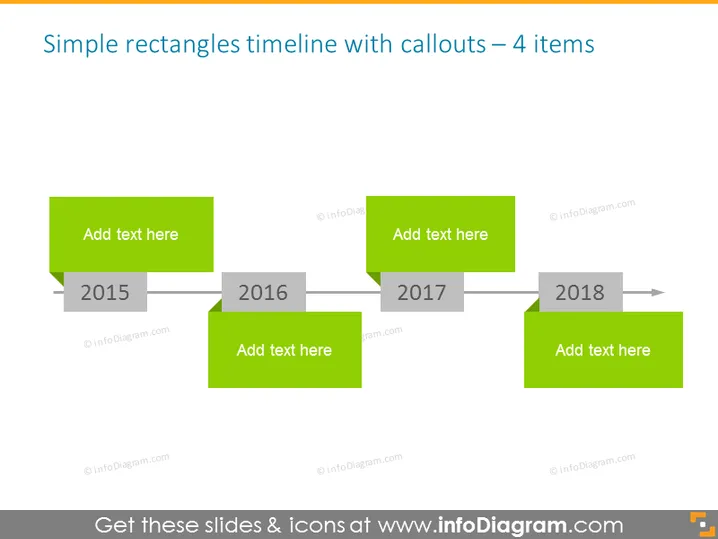
La diapositive représente une chronologie horizontale avec quatre rectangles d'appel verts pour ajouter du texte, chacun correspondant à une année entre 2015 et 2018. La chronologie représente une séquence d'événements, de processus ou de jalons. Chaque rectangle d'appel vert est connecté à un plus petit rectangle gris avec l'année écrite à l'intérieur, indiquant un point spécifique dans le temps. La chronologie progresse de gauche à droite, illustrant un flux de temps ou une progression des étapes.
L'apparence générale de la diapositive est propre et moderne, avec un arrière-plan neutre qui contraste avec les appels verts vifs. L'utilisation de flèches et l'alignement créent un sentiment de direction et de flux.


