
Your graphics add a nice touch to my presentations and I recently used them for one of my all-hands meetings. Your toolbox adds professionalism to my slides. Instead of using standard clipart.
Claude Jones, Director of Engineer, @Walmartlabs, USA
Your graphics add a nice touch to my presentations and I recently used them for one of my all-hands meetings. Your toolbox adds professionalism to my slides. Instead of using standard clipart.
Claude Jones, Director of Engineer, @Walmartlabs, USA
I needed a fresh look at some of my slides. I've tried to find a way to create a paintbrush effect, to underline, accentuate, add some color and the handwritten markers were just the things. Very easy to use, easy to size, change the color. It was an affordable, perfect solution and I'm happy to recommend it.
Anonymous, US
The crisp, clean look of the graphics, and the fact that it allowed me to easily edit and change the colors to match the template was my main reason for purchasing them.
Brandie Jenkins, E-learning Developer, USA
À partir du 1er janvier 2021, 65 250 000 personnes vivaient en France métropolitaine, tandis que 2 785 000 vivaient en France d'outre-mer, pour un total de 68 035 000 habitants dans la République française. Wikipedia
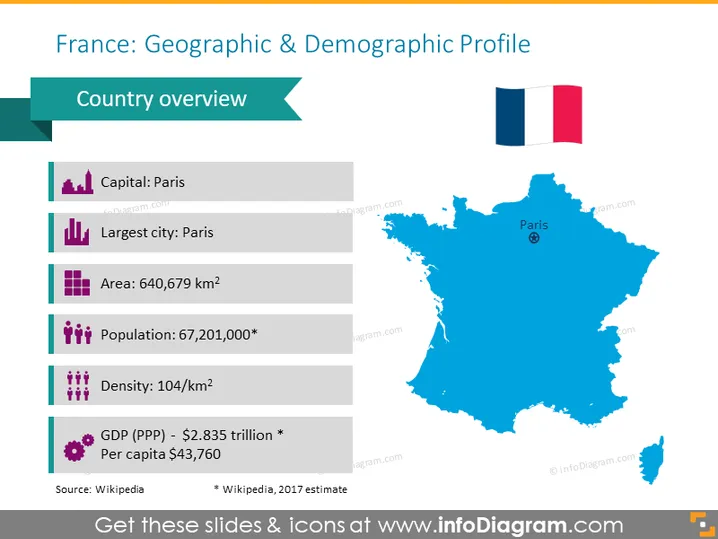
Que vous souhaitiez partager des informations générales sur la France ou un aperçu spécifique, ce modèle sera un outil utile pour gagner du temps lors de la création de votre diapositive sur les données géographiques et démographiques. Le modèle inclut une carte de la France pour mettre en évidence les caractéristiques géographiques, et 6 lignes d'informations supplémentaires à lister telles que la capitale, la superficie, la population et le PIB.
Cette diapositive de Profil Géographique et Démographique de la France fait partie de notre carte de l'Europe de l'Ouest avec territoires administratifs (Allemagne, France Modèles PPT modifiables).




