

Your graphics add a nice touch to my presentations and I recently used them for one of my all-hands meetings. Your toolbox adds professionalism to my slides. Instead of using standard clipart.
Claude Jones, Director of Engineer, @Walmartlabs, USA

Your graphics add a nice touch to my presentations and I recently used them for one of my all-hands meetings. Your toolbox adds professionalism to my slides. Instead of using standard clipart.
Claude Jones, Director of Engineer, @Walmartlabs, USA
I needed a fresh look at some of my slides. I've tried to find a way to create a paintbrush effect, to underline, accentuate, add some color and the handwritten markers were just the things. Very easy to use, easy to size, change the color. It was an affordable, perfect solution and I'm happy to recommend it.
Anonymous, US
The crisp, clean look of the graphics, and the fact that it allowed me to easily edit and change the colors to match the template was my main reason for purchasing them.
Brandie Jenkins, E-learning Developer, USA
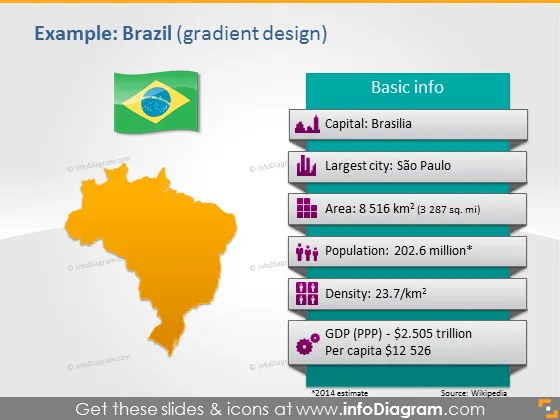
La diapositive fournit des informations clés sur le Brésil de manière claire et visuellement distincte. La diapositive intitulée "Exemple : Brésil (design en dégradé)" présente une liste de faits de base tels que la capitale étant Brasília ; São Paulo comme la plus grande ville ; une superficie de 8 516 km², ce qui équivaut à 3 287 miles carrés ; une population substantielle d'environ 202,6 millions ; une densité de population de 23,7 personnes par km² ; et un aperçu économique avec un PIB (PPA) d'environ 2,505 trillions de dollars et un revenu par habitant de 12 526 dollars.
La diapositive utilise des couleurs contrastées, avec un fond lumineux et des dégradés vibrants pour faire ressortir les informations. L'utilisation d'icônes associées à chaque point de données permet de faciliter la référence visuelle et améliore l'attrait esthétique global.



